class: title, self-paced Deploying and Scaling Microservices<br/>with Docker and Kubernetes<br/> .nav[*Self-paced version*] .debug[ ``` ``` These slides have been built from commit: 7bf50a4 [shared/title.md](https://github.com/BretFisher/kubernetes-mastery/tree/mastery/slides/shared/title.md)] --- class: title, in-person Deploying and Scaling Microservices<br/>with Docker and Kubernetes<br/><br/></br> .footnote[ **Course: http://www.kubernetesmastery.com** **Slides: http://container.training/** ] .debug[[shared/title.md](https://github.com/BretFisher/kubernetes-mastery/tree/mastery/slides/shared/title.md)] --- ## A brief introduction - This was initially written by [Jérôme Petazzoni](https://twitter.com/jpetazzo) to support in-person, instructor-led workshops and tutorials - Credit is also due to [multiple contributors](https://github.com/jpetazzo/container.training/graphs/contributors) — thank you! - You can also follow along on your own, at your own pace - We included as much information as possible in these slides - We recommend having a mentor to help you ... - ... Or be comfortable spending some time reading the Kubernetes [documentation](https://kubernetes.io/docs/) ... - ... And looking for answers on [StackOverflow](http://stackoverflow.com/questions/tagged/kubernetes) and other outlets .debug[[k8s/intro.md](https://github.com/BretFisher/kubernetes-mastery/tree/mastery/slides/k8s/intro.md)] --- class: self-paced ## Hands on, you shall practice - Nobody ever became a Jedi by spending their lives reading Wookiepedia - Likewise, it will take more than merely *reading* these slides to make you an expert - These slides include *tons* of exercises and examples - They assume that you have access to a Kubernetes cluster - If you are attending a workshop or tutorial: <br/>you will be given specific instructions to access your cluster - If you are doing this on your own: <br/>the first chapter will give you various options to get your own cluster .debug[[k8s/intro.md](https://github.com/BretFisher/kubernetes-mastery/tree/mastery/slides/k8s/intro.md)] --- ## Accessing these slides now - We recommend that you open these slides in your browser: http://container.training/ - Use arrows to move to next/previous slide (up, down, left, right, page up, page down) - Type a slide number + ENTER to go to that slide - The slide number is also visible in the URL bar (e.g. .../#123 for slide 123) .debug[[shared/about-slides.md](https://github.com/BretFisher/kubernetes-mastery/tree/mastery/slides/shared/about-slides.md)] --- ## Accessing these slides later - Slides will remain online so you can review them later if needed (let's say we'll keep them online at least 1 year, how about that?) - You can download the slides using that URL: http://container.training/slides.zip (then open the file `kube-selfpaced.yml.html`) - You will to find new versions of these slides on: https://container.training/ .debug[[shared/about-slides.md](https://github.com/BretFisher/kubernetes-mastery/tree/mastery/slides/shared/about-slides.md)] --- ## These slides are open source - You are welcome to use, re-use, share these slides - These slides are written in markdown - The sources of these slides are available in a public GitHub repository: https://github.com/jpetazzo/container.training - Typos? Mistakes? Questions? Feel free to hover over the bottom of the slide ... .footnote[.emoji[👇] Try it! The source file will be shown and you can view it on GitHub and fork and edit it.] <!-- .exercise[ ```open https://github.com/jpetazzo/container.training/tree/master/slides/common/about-slides.md``` ] --> .debug[[shared/about-slides.md](https://github.com/BretFisher/kubernetes-mastery/tree/mastery/slides/shared/about-slides.md)] --- class: extra-details ## Extra details - This slide has a little magnifying glass in the top left corner - This magnifying glass indicates slides that provide extra details - Feel free to skip them if: - you are in a hurry - you are new to this and want to avoid cognitive overload - you want only the most essential information - You can review these slides another time if you want, they'll be waiting for you ☺ .debug[[shared/about-slides.md](https://github.com/BretFisher/kubernetes-mastery/tree/mastery/slides/shared/about-slides.md)] --- class: in-person, chat-room ## Chat room - We've set up a chat room that we will monitor during the workshop - Don't hesitate to use it to ask questions, or get help, or share feedback - The chat room will also be available after the workshop - Join the chat room: [Slack](https://dockercommunity.slack.com/messages/C7GKACWDV) - Say hi in the chat room! .debug[[shared/about-slides.md](https://github.com/BretFisher/kubernetes-mastery/tree/mastery/slides/shared/about-slides.md)] --- name: toc-chapter-1 ## Chapter 1 - [Pre-requirements](#toc-pre-requirements) - [Our sample application](#toc-our-sample-application) - [Kubernetes concepts](#toc-kubernetes-concepts) .debug[(auto-generated TOC)] --- name: toc-chapter-2 ## Chapter 2 - [First contact with `kubectl`](#toc-first-contact-with-kubectl) - [Running our first containers on Kubernetes](#toc-running-our-first-containers-on-kubernetes) - [Accessing logs from the CLI](#toc-accessing-logs-from-the-cli) - [Declarative vs imperative](#toc-declarative-vs-imperative) .debug[(auto-generated TOC)] --- name: toc-chapter-3 ## Chapter 3 - [Kubernetes network model](#toc-kubernetes-network-model) - [Exposing containers](#toc-exposing-containers) - [Shipping images with a registry](#toc-shipping-images-with-a-registry) - [Running DockerCoins on Kubernetes](#toc-running-dockercoins-on-kubernetes) - [Deploying with YAML](#toc-deploying-with-yaml) .debug[(auto-generated TOC)] --- name: toc-chapter-4 ## Chapter 4 - [Setting up Kubernetes](#toc-setting-up-kubernetes) - [The Kubernetes Dashboard](#toc-the-kubernetes-dashboard) - [Security implications of `kubectl apply`](#toc-security-implications-of-kubectl-apply) - [Scaling our demo app](#toc-scaling-our-demo-app) - [Daemon sets](#toc-daemon-sets) - [Labels and selectors](#toc-labels-and-selectors) - [Authoring YAML](#toc-authoring-yaml) .debug[(auto-generated TOC)] --- name: toc-chapter-5 ## Chapter 5 - [Rolling updates](#toc-rolling-updates) - [Healthchecks](#toc-healthchecks) - [Recording deployment actions](#toc-recording-deployment-actions) .debug[(auto-generated TOC)] --- name: toc-chapter-6 ## Chapter 6 - [Namespaces](#toc-namespaces) - [Controlling a Kubernetes cluster remotely](#toc-controlling-a-kubernetes-cluster-remotely) - [Accessing internal services](#toc-accessing-internal-services) - [Accessing the API with `kubectl proxy`](#toc-accessing-the-api-with-kubectl-proxy) .debug[(auto-generated TOC)] --- name: toc-chapter-7 ## Chapter 7 - [Exposing HTTP services with Ingress resources](#toc-exposing-http-services-with-ingress-resources) - [Kustomize](#toc-kustomize) - [Managing stacks with Helm](#toc-managing-stacks-with-helm) - [Helm chart format](#toc-helm-chart-format) - [Creating a basic chart](#toc-creating-a-basic-chart) - [Creating better Helm charts](#toc-creating-better-helm-charts) - [Helm secrets](#toc-helm-secrets) .debug[(auto-generated TOC)] --- name: toc-chapter-8 ## Chapter 8 - [Network policies](#toc-network-policies) - [Authentication and authorization](#toc-authentication-and-authorization) - [Pod Security Policies](#toc-pod-security-policies) - [The CSR API](#toc-the-csr-api) - [OpenID Connect](#toc-openid-connect) - [Securing the control plane](#toc-securing-the-control-plane) .debug[(auto-generated TOC)] --- name: toc-chapter-9 ## Chapter 9 - [Volumes](#toc-volumes) - [Building images with the Docker Engine](#toc-building-images-with-the-docker-engine) - [Building images with Kaniko](#toc-building-images-with-kaniko) .debug[(auto-generated TOC)] --- name: toc-chapter-10 ## Chapter 10 - [Managing configuration](#toc-managing-configuration) - [Stateful sets](#toc-stateful-sets) - [Running a Consul cluster](#toc-running-a-consul-cluster) - [Persistent Volumes Claims](#toc-persistent-volumes-claims) - [Local Persistent Volumes](#toc-local-persistent-volumes) - [Highly available Persistent Volumes](#toc-highly-available-persistent-volumes) .debug[(auto-generated TOC)] --- name: toc-chapter-11 ## Chapter 11 - [Centralized logging](#toc-centralized-logging) - [Collecting metrics with Prometheus](#toc-collecting-metrics-with-prometheus) - [Resource Limits](#toc-resource-limits) - [Defining min, max, and default resources](#toc-defining-min-max-and-default-resources) - [Namespace quotas](#toc-namespace-quotas) - [Limiting resources in practice](#toc-limiting-resources-in-practice) - [Checking pod and node resource usage](#toc-checking-pod-and-node-resource-usage) - [Cluster sizing](#toc-cluster-sizing) - [The Horizontal Pod Autoscaler](#toc-the-horizontal-pod-autoscaler) .debug[(auto-generated TOC)] --- name: toc-chapter-12 ## Chapter 12 - [Extending the Kubernetes API](#toc-extending-the-kubernetes-api) - [Operators](#toc-operators) - [Owners and dependents](#toc-owners-and-dependents) .debug[(auto-generated TOC)] --- name: toc-chapter-13 ## Chapter 13 - [Building our own cluster](#toc-building-our-own-cluster) - [Adding nodes to the cluster](#toc-adding-nodes-to-the-cluster) - [The Container Network Interface](#toc-the-container-network-interface) - [API server availability](#toc-api-server-availability) - [Static pods](#toc-static-pods) .debug[(auto-generated TOC)] --- name: toc-chapter-14 ## Chapter 14 - [Upgrading clusters](#toc-upgrading-clusters) - [Backing up clusters](#toc-backing-up-clusters) - [The Cloud Controller Manager](#toc-the-cloud-controller-manager) - [Git-based workflows](#toc-git-based-workflows) .debug[(auto-generated TOC)] --- name: toc-chapter-15 ## Chapter 15 - [Last words](#toc-last-words) - [Links and resources](#toc-links-and-resources) .debug[(auto-generated TOC)] .debug[[shared/toc.md](https://github.com/BretFisher/kubernetes-mastery/tree/mastery/slides/shared/toc.md)] --- class: pic .interstitial[] --- name: toc-pre-requirements class: title Pre-requirements .nav[ [Previous section](#toc-) | [Back to table of contents](#toc-chapter-1) | [Next section](#toc-our-sample-application) ] .debug[(automatically generated title slide)] --- # Pre-requirements - Be comfortable with the UNIX command line - navigating directories - editing files - a little bit of bash-fu (environment variables, loops) - Some Docker knowledge - `docker run`, `docker ps`, `docker build` - ideally, you know how to write a Dockerfile and build it <br/> (even if it's a `FROM` line and a couple of `RUN` commands) - It's totally OK if you are not a Docker expert! .debug[[shared/prereqs.md](https://github.com/BretFisher/kubernetes-mastery/tree/mastery/slides/shared/prereqs.md)] --- class: title *Tell me and I forget.* <br/> *Teach me and I remember.* <br/> *Involve me and I learn.* Misattributed to Benjamin Franklin [(Probably inspired by Chinese Confucian philosopher Xunzi)](https://www.barrypopik.com/index.php/new_york_city/entry/tell_me_and_i_forget_teach_me_and_i_may_remember_involve_me_and_i_will_lear/) .debug[[shared/prereqs.md](https://github.com/BretFisher/kubernetes-mastery/tree/mastery/slides/shared/prereqs.md)] --- ## Hands-on sections - The whole workshop is hands-on - We are going to build, ship, and run containers! - You are invited to reproduce all the demos - All hands-on sections are clearly identified, like the gray rectangle below .exercise[ - This is the stuff you're supposed to do! - Go to http://container.training/ to view these slides - Join the chat room: [Slack](https://dockercommunity.slack.com/messages/C7GKACWDV) <!-- ```open http://container.training/``` --> ] .debug[[shared/prereqs.md](https://github.com/BretFisher/kubernetes-mastery/tree/mastery/slides/shared/prereqs.md)] --- class: in-person ## Where are we going to run our containers? .debug[[shared/prereqs.md](https://github.com/BretFisher/kubernetes-mastery/tree/mastery/slides/shared/prereqs.md)] --- class: in-person, pic  .debug[[shared/prereqs.md](https://github.com/BretFisher/kubernetes-mastery/tree/mastery/slides/shared/prereqs.md)] --- class: in-person ## You get a cluster of cloud VMs - Each person gets a private cluster of cloud VMs (not shared with anybody else) - They'll remain up for the duration of the workshop - You should have a little card with login+password+IP addresses - You can automatically SSH from one VM to another - The nodes have aliases: `node1`, `node2`, etc. .debug[[shared/prereqs.md](https://github.com/BretFisher/kubernetes-mastery/tree/mastery/slides/shared/prereqs.md)] --- class: in-person ## Why don't we run containers locally? - Installing this stuff can be hard on some machines (32 bits CPU or OS... Laptops without administrator access... etc.) - *"The whole team downloaded all these container images from the WiFi! <br/>... and it went great!"* (Literally no-one ever) - All you need is a computer (or even a phone or tablet!), with: - an internet connection - a web browser - an SSH client .debug[[shared/prereqs.md](https://github.com/BretFisher/kubernetes-mastery/tree/mastery/slides/shared/prereqs.md)] --- class: in-person ## SSH clients - On Linux, OS X, FreeBSD... you are probably all set - On Windows, get one of these: - [putty](http://www.putty.org/) - Microsoft [Win32 OpenSSH](https://github.com/PowerShell/Win32-OpenSSH/wiki/Install-Win32-OpenSSH) - [Git BASH](https://git-for-windows.github.io/) - [MobaXterm](http://mobaxterm.mobatek.net/) - On Android, [JuiceSSH](https://juicessh.com/) ([Play Store](https://play.google.com/store/apps/details?id=com.sonelli.juicessh)) works pretty well - Nice-to-have: [Mosh](https://mosh.org/) instead of SSH, if your internet connection tends to lose packets .debug[[shared/prereqs.md](https://github.com/BretFisher/kubernetes-mastery/tree/mastery/slides/shared/prereqs.md)] --- class: in-person, extra-details ## What is this Mosh thing? *You don't have to use Mosh or even know about it to follow along. <br/> We're just telling you about it because some of us think it's cool!* - Mosh is "the mobile shell" - It is essentially SSH over UDP, with roaming features - It retransmits packets quickly, so it works great even on lossy connections (Like hotel or conference WiFi) - It has intelligent local echo, so it works great even in high-latency connections (Like hotel or conference WiFi) - It supports transparent roaming when your client IP address changes (Like when you hop from hotel to conference WiFi) .debug[[shared/prereqs.md](https://github.com/BretFisher/kubernetes-mastery/tree/mastery/slides/shared/prereqs.md)] --- class: in-person, extra-details ## Using Mosh - To install it: `(apt|yum|brew) install mosh` - It has been pre-installed on the VMs that we are using - To connect to a remote machine: `mosh user@host` (It is going to establish an SSH connection, then hand off to UDP) - It requires UDP ports to be open (By default, it uses a UDP port between 60000 and 61000) .debug[[shared/prereqs.md](https://github.com/BretFisher/kubernetes-mastery/tree/mastery/slides/shared/prereqs.md)] --- class: in-person ## Connecting to our lab environment .exercise[ - Log into the first VM (`node1`) with your SSH client: ```bash ssh `user`@`A.B.C.D` ``` (Replace `user` and `A.B.C.D` with the user and IP address provided to you) <!-- ```bash for N in $(awk '/\Wnode/{print $2}' /etc/hosts); do ssh -o StrictHostKeyChecking=no $N true done ``` ```bash ### FIXME find a way to reset the cluster, maybe? ``` --> ] You should see a prompt looking like this: ``` [A.B.C.D] (...) user@node1 ~ $ ``` If anything goes wrong — ask for help! .debug[[shared/connecting.md](https://github.com/BretFisher/kubernetes-mastery/tree/mastery/slides/shared/connecting.md)] --- ## Doing or re-doing the workshop on your own? - Use something like [Play-With-Docker](http://play-with-docker.com/) or [Play-With-Kubernetes](https://training.play-with-kubernetes.com/) Zero setup effort; but environment are short-lived and might have limited resources - Create your own cluster (local or cloud VMs) Small setup effort; small cost; flexible environments - Create a bunch of clusters for you and your friends ([instructions](https://github.com/jpetazzo/container.training/tree/master/prepare-vms)) Bigger setup effort; ideal for group training .debug[[shared/connecting.md](https://github.com/BretFisher/kubernetes-mastery/tree/mastery/slides/shared/connecting.md)] --- ## For a consistent Kubernetes experience ... - If you are using your own Kubernetes cluster, you can use [shpod](https://github.com/jpetazzo/shpod) - `shpod` provides a shell running in a pod on your own cluster - It comes with many tools pre-installed (helm, stern...) - These tools are used in many exercises in these slides - `shpod` also gives you completion and a fancy prompt .debug[[shared/connecting.md](https://github.com/BretFisher/kubernetes-mastery/tree/mastery/slides/shared/connecting.md)] --- class: self-paced ## Get your own Docker nodes - If you already have some Docker nodes: great! - If not: let's get some thanks to Play-With-Docker .exercise[ - Go to http://www.play-with-docker.com/ - Log in - Create your first node <!-- ```open http://www.play-with-docker.com/``` --> ] You will need a Docker ID to use Play-With-Docker. (Creating a Docker ID is free.) .debug[[shared/connecting.md](https://github.com/BretFisher/kubernetes-mastery/tree/mastery/slides/shared/connecting.md)] --- ## We will (mostly) interact with node1 only *These remarks apply only when using multiple nodes, of course.* - Unless instructed, **all commands must be run from the first VM, `node1`** - We will only check out/copy the code on `node1` - During normal operations, we do not need access to the other nodes - If we had to troubleshoot issues, we would use a combination of: - SSH (to access system logs, daemon status...) - Docker API (to check running containers and container engine status) .debug[[shared/connecting.md](https://github.com/BretFisher/kubernetes-mastery/tree/mastery/slides/shared/connecting.md)] --- ## Terminals Once in a while, the instructions will say: <br/>"Open a new terminal." There are multiple ways to do this: - create a new window or tab on your machine, and SSH into the VM; - use screen or tmux on the VM and open a new window from there. You are welcome to use the method that you feel the most comfortable with. .debug[[shared/connecting.md](https://github.com/BretFisher/kubernetes-mastery/tree/mastery/slides/shared/connecting.md)] --- ## Tmux cheatsheet [Tmux](https://en.wikipedia.org/wiki/Tmux) is a terminal multiplexer like `screen`. *You don't have to use it or even know about it to follow along. <br/> But some of us like to use it to switch between terminals. <br/> It has been preinstalled on your workshop nodes.* - Ctrl-b c → creates a new window - Ctrl-b n → go to next window - Ctrl-b p → go to previous window - Ctrl-b " → split window top/bottom - Ctrl-b % → split window left/right - Ctrl-b Alt-1 → rearrange windows in columns - Ctrl-b Alt-2 → rearrange windows in rows - Ctrl-b arrows → navigate to other windows - Ctrl-b d → detach session - tmux attach → reattach to session .debug[[shared/connecting.md](https://github.com/BretFisher/kubernetes-mastery/tree/mastery/slides/shared/connecting.md)] --- ## Versions installed - Kubernetes 1.17.2 - Docker Engine 19.03.5 - Docker Compose 1.24.1 <!-- ##VERSION## --> .exercise[ - Check all installed versions: ```bash kubectl version docker version docker-compose -v ``` ] .debug[[k8s/versions-k8s.md](https://github.com/BretFisher/kubernetes-mastery/tree/mastery/slides/k8s/versions-k8s.md)] --- class: extra-details ## Kubernetes and Docker compatibility - Kubernetes 1.17 validates Docker Engine version [up to 19.03](https://github.com/kubernetes/kubernetes/pull/84476) *however ...* - Kubernetes 1.15 validates Docker Engine versions [up to 18.09](https://github.com/kubernetes/kubernetes/blob/master/CHANGELOG-1.15.md#dependencies) <br/> (the latest version when Kubernetes 1.14 was released) - Kubernetes 1.13 only validates Docker Engine versions [up to 18.06](https://github.com/kubernetes/kubernetes/blob/master/CHANGELOG-1.13.md#external-dependencies) - Is it a problem if I use Kubernetes with a "too recent" Docker Engine? -- class: extra-details - No! - "Validates" = continuous integration builds with very extensive (and expensive) testing - The Docker API is versioned, and offers strong backward-compatibility <br/> (if a client uses e.g. API v1.25, the Docker Engine will keep behaving the same way) .debug[[k8s/versions-k8s.md](https://github.com/BretFisher/kubernetes-mastery/tree/mastery/slides/k8s/versions-k8s.md)] --- ## Kubernetes versioning and cadence - Kubernetes versions are expressed using *semantic versioning* (a Kubernetes version is expressed as MAJOR.MINOR.PATCH) - There is a new *patch* release whenever needed (generally, there is about [2 to 4 weeks](https://github.com/kubernetes/sig-release/blob/master/release-engineering/role-handbooks/patch-release-team.md#release-timing) between patch releases, except when a critical bug or vulnerability is found: in that case, a patch release will follow as fast as possible) - There is a new *minor* release approximately every 3 months - At any given time, 3 *minor* releases are maintained (in other words, a given *minor* release is maintained about 9 months) .debug[[k8s/versions-k8s.md](https://github.com/BretFisher/kubernetes-mastery/tree/mastery/slides/k8s/versions-k8s.md)] --- ## Kubernetes version compatibility *Should my version of `kubectl` match exactly my cluster version?* - `kubectl` can be up to one minor version older or newer than the cluster (if cluster version is 1.15.X, `kubectl` can be 1.14.Y, 1.15.Y, or 1.16.Y) - Things *might* work with larger version differences (but they will probably fail randomly, so be careful) - This is an example of an error indicating version compability issues: ``` error: SchemaError(io.k8s.api.autoscaling.v2beta1.ExternalMetricStatus): invalid object doesn't have additional properties ``` - Check [the documentation](https://kubernetes.io/docs/setup/release/version-skew-policy/#kubectl) for the whole story about compatibility .debug[[k8s/versions-k8s.md](https://github.com/BretFisher/kubernetes-mastery/tree/mastery/slides/k8s/versions-k8s.md)] --- class: pic .interstitial[] --- name: toc-our-sample-application class: title Our sample application .nav[ [Previous section](#toc-pre-requirements) | [Back to table of contents](#toc-chapter-1) | [Next section](#toc-kubernetes-concepts) ] .debug[(automatically generated title slide)] --- class: not-mastery # Our sample application - We will clone the GitHub repository onto our `node1` - The repository also contains scripts and tools that we will use through the workshop .exercise[ <!-- ```bash cd ~ if [ -d container.training ]; then mv container.training container.training.$RANDOM fi ``` --> - Clone the repository on `node1`: ```bash git clone https://github.com/jpetazzo/container.training ``` ] (You can also fork the repository on GitHub and clone your fork if you prefer that.) .debug[[shared/sampleapp.md](https://github.com/BretFisher/kubernetes-mastery/tree/mastery/slides/shared/sampleapp.md)] --- class: not-mastery ## Downloading and running the application Let's start this before we look around, as downloading will take a little time... .exercise[ - Go to the `dockercoins` directory, in the cloned repo: ```bash cd ~/container.training/dockercoins ``` - Use Compose to build and run all containers: ```bash docker-compose up ``` <!-- ```longwait units of work done``` --> ] Compose tells Docker to build all container images (pulling the corresponding base images), then starts all containers, and displays aggregated logs. .debug[[shared/sampleapp.md](https://github.com/BretFisher/kubernetes-mastery/tree/mastery/slides/shared/sampleapp.md)] --- ## What's this application? -- - It is a DockerCoin miner! .emoji[💰🐳📦🚢] -- - No, you can't buy coffee with DockerCoins -- - How DockerCoins works: - generate a few random bytes - hash these bytes - increment a counter (to keep track of speed) - repeat forever! -- - DockerCoins is *not* a cryptocurrency (the only common points are "randomness," "hashing," and "coins" in the name) .debug[[shared/sampleapp.md](https://github.com/BretFisher/kubernetes-mastery/tree/mastery/slides/shared/sampleapp.md)] --- ## DockerCoins in the microservices era - DockerCoins is made of 5 services: - `rng` = web service generating random bytes - `hasher` = web service computing hash of POSTed data - `worker` = background process calling `rng` and `hasher` - `webui` = web interface to watch progress - `redis` = data store (holds a counter updated by `worker`) - These 5 services are visible in the application's Compose file, [dockercoins-compose.yml]( https://github.com/BretFisher/kubernetes-mastery/blob/mastery/k8s/dockercoins-compose.yml) .debug[[shared/sampleapp.md](https://github.com/BretFisher/kubernetes-mastery/tree/mastery/slides/shared/sampleapp.md)] --- ## How DockerCoins works - `worker` invokes web service `rng` to generate random bytes - `worker` invokes web service `hasher` to hash these bytes - `worker` does this in an infinite loop - Every second, `worker` updates `redis` to indicate how many loops were done - `webui` queries `redis`, and computes and exposes "hashing speed" in our browser *(See diagram on next slide!)* .debug[[shared/sampleapp.md](https://github.com/BretFisher/kubernetes-mastery/tree/mastery/slides/shared/sampleapp.md)] --- class: pic  .debug[[shared/sampleapp.md](https://github.com/BretFisher/kubernetes-mastery/tree/mastery/slides/shared/sampleapp.md)] --- ## Service discovery in container-land How does each service find out the address of the other ones? -- - We do not hard-code IP addresses in the code - We do not hard-code FQDNs in the code, either - We just connect to a service name, and container-magic does the rest (And by container-magic, we mean "a crafty, dynamic, embedded DNS server") .debug[[shared/sampleapp.md](https://github.com/BretFisher/kubernetes-mastery/tree/mastery/slides/shared/sampleapp.md)] --- ## Example in `worker/worker.py` ```python redis = Redis("`redis`") def get_random_bytes(): r = requests.get("http://`rng`/32") return r.content def hash_bytes(data): r = requests.post("http://`hasher`/", data=data, headers={"Content-Type": "application/octet-stream"}) ``` (Full source code available [here]( https://github.com/jpetazzo/container.training/blob/8279a3bce9398f7c1a53bdd95187c53eda4e6435/dockercoins/worker/worker.py#L17 )) .debug[[shared/sampleapp.md](https://github.com/BretFisher/kubernetes-mastery/tree/mastery/slides/shared/sampleapp.md)] --- class: extra-details, not-mastery ## Links, naming, and service discovery - Containers can have network aliases (resolvable through DNS) - Compose file version 2+ makes each container reachable through its service name - Compose file version 1 required "links" sections to accomplish this - Network aliases are automatically namespaced - you can have multiple apps declaring and using a service named `database` - containers in the blue app will resolve `database` to the IP of the blue database - containers in the green app will resolve `database` to the IP of the green database .debug[[shared/sampleapp.md](https://github.com/BretFisher/kubernetes-mastery/tree/mastery/slides/shared/sampleapp.md)] --- class: not-mastery ## Show me the code! - You can check the GitHub repository with all the materials of this workshop: <br/>https://github.com/jpetazzo/container.training - The application is in the [dockercoins]( https://github.com/jpetazzo/container.training/tree/master/dockercoins) subdirectory - The Compose file ([docker-compose.yml]( https://github.com/jpetazzo/container.training/blob/master/dockercoins/docker-compose.yml)) lists all 5 services - `redis` is using an official image from the Docker Hub - `hasher`, `rng`, `worker`, `webui` are each built from a Dockerfile - Each service's Dockerfile and source code is in its own directory (`hasher` is in the [hasher](https://github.com/jpetazzo/container.training/blob/master/dockercoins/hasher/) directory, `rng` is in the [rng](https://github.com/jpetazzo/container.training/blob/master/dockercoins/rng/) directory, etc.) .debug[[shared/sampleapp.md](https://github.com/BretFisher/kubernetes-mastery/tree/mastery/slides/shared/sampleapp.md)] --- class: extra-details, not-mastery ## Compose file format version *This is relevant only if you have used Compose before 2016...* - Compose 1.6 introduced support for a new Compose file format (aka "v2") - Services are no longer at the top level, but under a `services` section - There has to be a `version` key at the top level, with value `"2"` (as a string, not an integer) - Containers are placed on a dedicated network, making links unnecessary - There are other minor differences, but upgrade is easy and straightforward .debug[[shared/sampleapp.md](https://github.com/BretFisher/kubernetes-mastery/tree/mastery/slides/shared/sampleapp.md)] --- class: not-mastery ## Our application at work - On the left-hand side, the "rainbow strip" shows the container names - On the right-hand side, we see the output of our containers - We can see the `worker` service making requests to `rng` and `hasher` - For `rng` and `hasher`, we see HTTP access logs .debug[[shared/sampleapp.md](https://github.com/BretFisher/kubernetes-mastery/tree/mastery/slides/shared/sampleapp.md)] --- ## DockerCoins at work - `worker` will log HTTP requests to `rng` and `hasher` - `rng` and `hasher` will log incoming HTTP requests - `webui` will give us a graph on coins mined per second <img style="max-height:400px" src="k8smastery/dockercoins-webui.png"> .debug[[shared/sampleapp.md](https://github.com/BretFisher/kubernetes-mastery/tree/mastery/slides/shared/sampleapp.md)] --- ## Check out the app in Docker Compose - Compose is (still) great for local development - You can test this app if you have Docker and Compose installed - If not, remember [play-with-docker.com](https://play-with-docker.com) .exercise[ - Download the compose file somewhere and run it ```bash curl -o docker-compose.yml https://k8smastery.com/dockercoins-compose.yml docker-compose up ``` ] - View the `webui` on `localhost:8000` or click the `8080` link in PWD .debug[[shared/sampleapp.md](https://github.com/BretFisher/kubernetes-mastery/tree/mastery/slides/shared/sampleapp.md)] --- class: not-mastery ## Connecting to the web UI - "Logs are exciting and fun!" (No one, ever) - The `webui` container exposes a web dashboard; let's view it .exercise[ - With a web browser, connect to `node1` on port 8000 - Remember: the `nodeX` aliases are valid only on the nodes themselves - In your browser, you need to enter the IP address of your node <!-- ```open http://node1:8000``` --> ] A drawing area should show up, and after a few seconds, a blue graph will appear. .debug[[shared/sampleapp.md](https://github.com/BretFisher/kubernetes-mastery/tree/mastery/slides/shared/sampleapp.md)] --- class: self-paced, extra-details ## If the graph doesn't load If you just see a `Page not found` error, it might be because your Docker Engine is running on a different machine. This can be the case if: - you are using the Docker Toolbox - you are using a VM (local or remote) created with Docker Machine - you are controlling a remote Docker Engine When you run DockerCoins in development mode, the web UI static files are mapped to the container using a volume. Alas, volumes can only work on a local environment, or when using Docker Desktop for Mac or Windows. How to fix this? Stop the app with `^C`, edit `dockercoins.yml`, comment out the `volumes` section, and try again. .debug[[shared/sampleapp.md](https://github.com/BretFisher/kubernetes-mastery/tree/mastery/slides/shared/sampleapp.md)] --- class: extra-details ## Why does the speed seem irregular? - It *looks like* the speed is approximately 4 hashes/second - Or more precisely: 4 hashes/second, with regular dips down to zero - Why? -- class: extra-details - The app actually has a constant, steady speed: 3.33 hashes/second <br/> (which corresponds to 1 hash every 0.3 seconds, for *reasons*) - Yes, and? .debug[[shared/sampleapp.md](https://github.com/BretFisher/kubernetes-mastery/tree/mastery/slides/shared/sampleapp.md)] --- class: extra-details ## The reason why this graph is *not awesome* - The worker doesn't update the counter after every loop, but up to once per second - The speed is computed by the browser, checking the counter about once per second - Between two consecutive updates, the counter will increase either by 4, or by 0 - The perceived speed will therefore be 4 - 4 - 4 - 0 - 4 - 4 - 0 etc. - What can we conclude from this? -- class: extra-details - "I'm clearly incapable of writing good frontend code!" 😀 — Jérôme .debug[[shared/sampleapp.md](https://github.com/BretFisher/kubernetes-mastery/tree/mastery/slides/shared/sampleapp.md)] --- ## Stopping the application - If we interrupt Compose (with `^C`), it will politely ask the Docker Engine to stop the app - The Docker Engine will send a `TERM` signal to the containers - If the containers do not exit in a timely manner, the Engine sends a `KILL` signal .exercise[ - Stop the application by hitting `^C` <!-- ```key ^C``` --> ] -- Some containers exit immediately, others take longer. The containers that do not handle `SIGTERM` end up being killed after a 10s timeout. If we are very impatient, we can hit `^C` a second time! .debug[[shared/sampleapp.md](https://github.com/BretFisher/kubernetes-mastery/tree/mastery/slides/shared/sampleapp.md)] --- class: cleanup ## Clean up - Before moving on, let's remove those containers - Or if using PWD for compose, just hit "close session" button .exercise[ - Tell Compose to remove everything: ```bash docker-compose down ``` ] .debug[[shared/composedown.md](https://github.com/BretFisher/kubernetes-mastery/tree/mastery/slides/shared/composedown.md)] --- class: pic .interstitial[] --- name: toc-kubernetes-concepts class: title Kubernetes concepts .nav[ [Previous section](#toc-our-sample-application) | [Back to table of contents](#toc-chapter-1) | [Next section](#toc-first-contact-with-kubectl) ] .debug[(automatically generated title slide)] --- # Kubernetes concepts - Kubernetes is a container management system - It runs and manages containerized applications on a cluster -- - What does that really mean? .debug[[k8s/concepts-k8s.md](https://github.com/BretFisher/kubernetes-mastery/tree/mastery/slides/k8s/concepts-k8s.md)] --- ## Basic things we can ask Kubernetes to do -- - Start 5 containers using image `atseashop/api:v1.3` -- - Place an internal load balancer in front of these containers -- - Start 10 containers using image `atseashop/webfront:v1.3` -- - Place a public load balancer in front of these containers -- - It's Black Friday (or Christmas), traffic spikes, grow our cluster and add containers -- - New release! Replace my containers with the new image `atseashop/webfront:v1.4` -- - Keep processing requests during the upgrade; update my containers one at a time .debug[[k8s/concepts-k8s.md](https://github.com/BretFisher/kubernetes-mastery/tree/mastery/slides/k8s/concepts-k8s.md)] --- ## Other things that Kubernetes can do for us - Autoscaling (straightforward on CPU; more complex on other metrics) - Resource management and scheduling (reserve CPU/RAM for containers; placement constraints) - Advanced rollout patterns (blue/green deployment, canary deployment) .debug[[k8s/concepts-k8s.md](https://github.com/BretFisher/kubernetes-mastery/tree/mastery/slides/k8s/concepts-k8s.md)] --- ## More things that Kubernetes can do for us - Batch jobs (one-off; parallel; also cron-style periodic execution) - Fine-grained access control (defining *what* can be done by *whom* on *which* resources) - Stateful services (databases, message queues, etc.) - Automating complex tasks with *operators* (e.g. database replication, failover, etc.) .debug[[k8s/concepts-k8s.md](https://github.com/BretFisher/kubernetes-mastery/tree/mastery/slides/k8s/concepts-k8s.md)] --- ## Kubernetes architecture .debug[[k8s/concepts-k8s.md](https://github.com/BretFisher/kubernetes-mastery/tree/mastery/slides/k8s/concepts-k8s.md)] --- class: pic 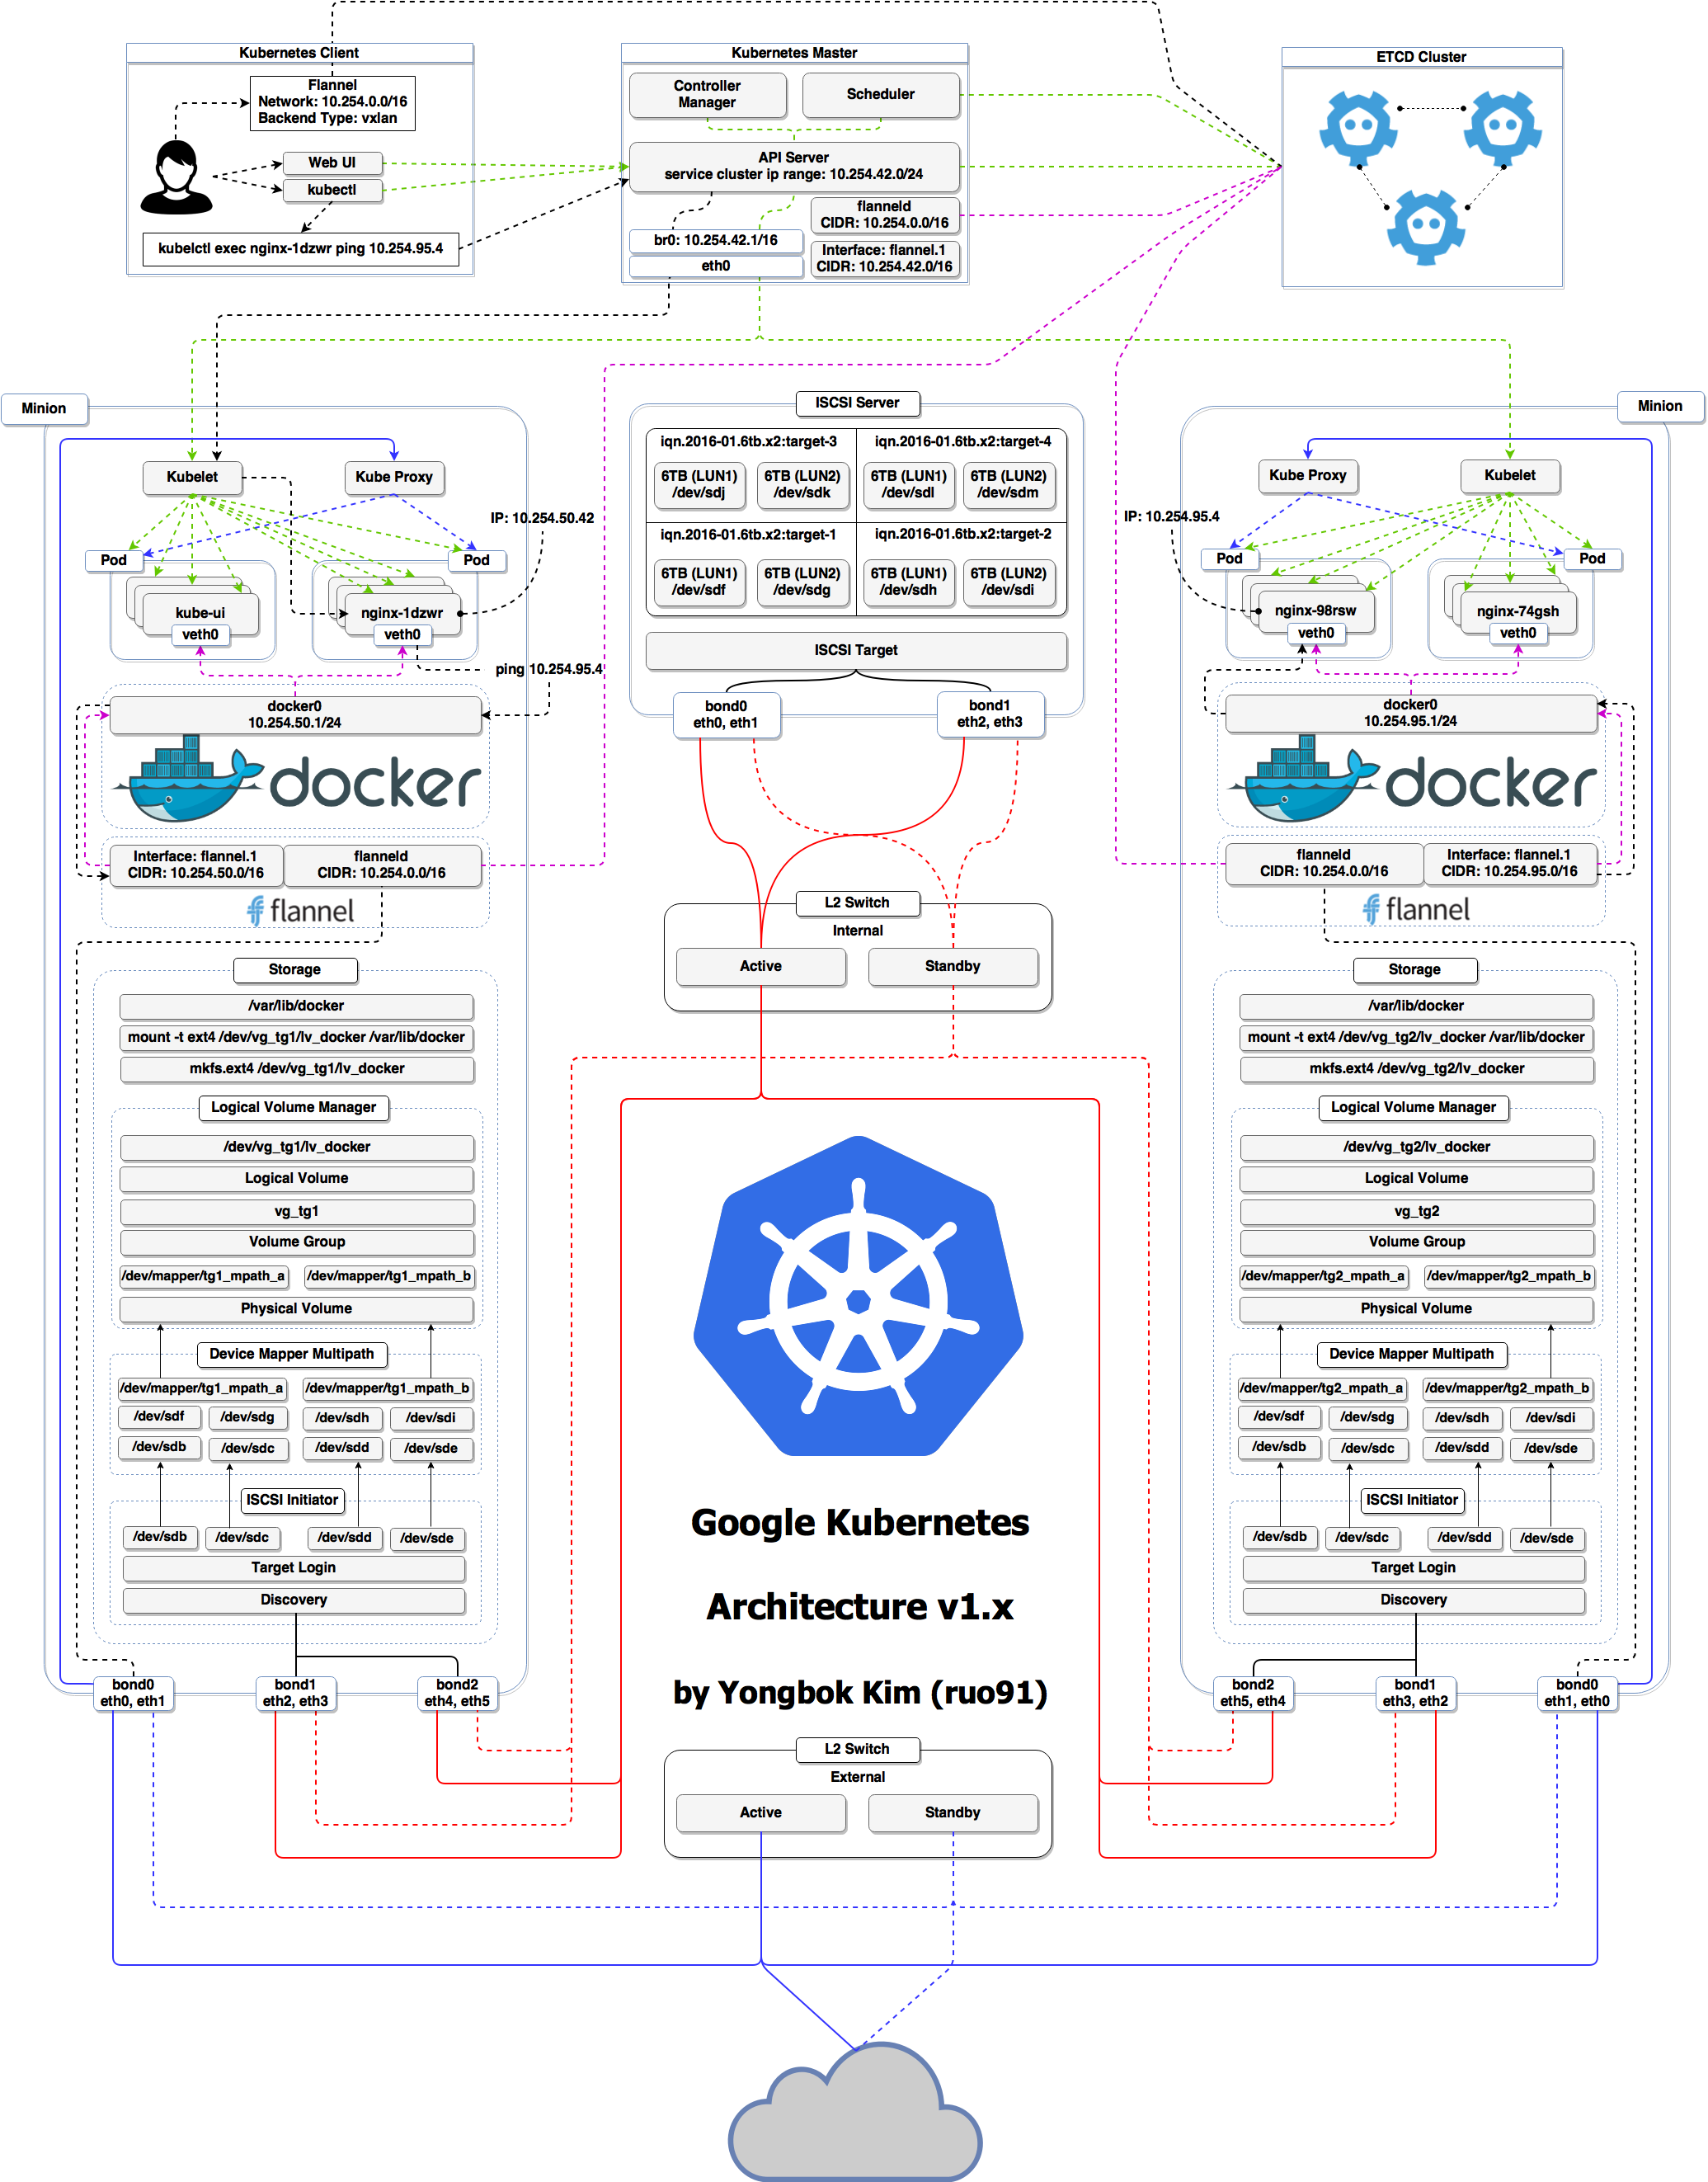 .debug[[k8s/concepts-k8s.md](https://github.com/BretFisher/kubernetes-mastery/tree/mastery/slides/k8s/concepts-k8s.md)] --- ## Kubernetes architecture - Ha ha ha ha - OK, I was trying to scare you, it's much simpler than that ❤️ .debug[[k8s/concepts-k8s.md](https://github.com/BretFisher/kubernetes-mastery/tree/mastery/slides/k8s/concepts-k8s.md)] --- class: pic 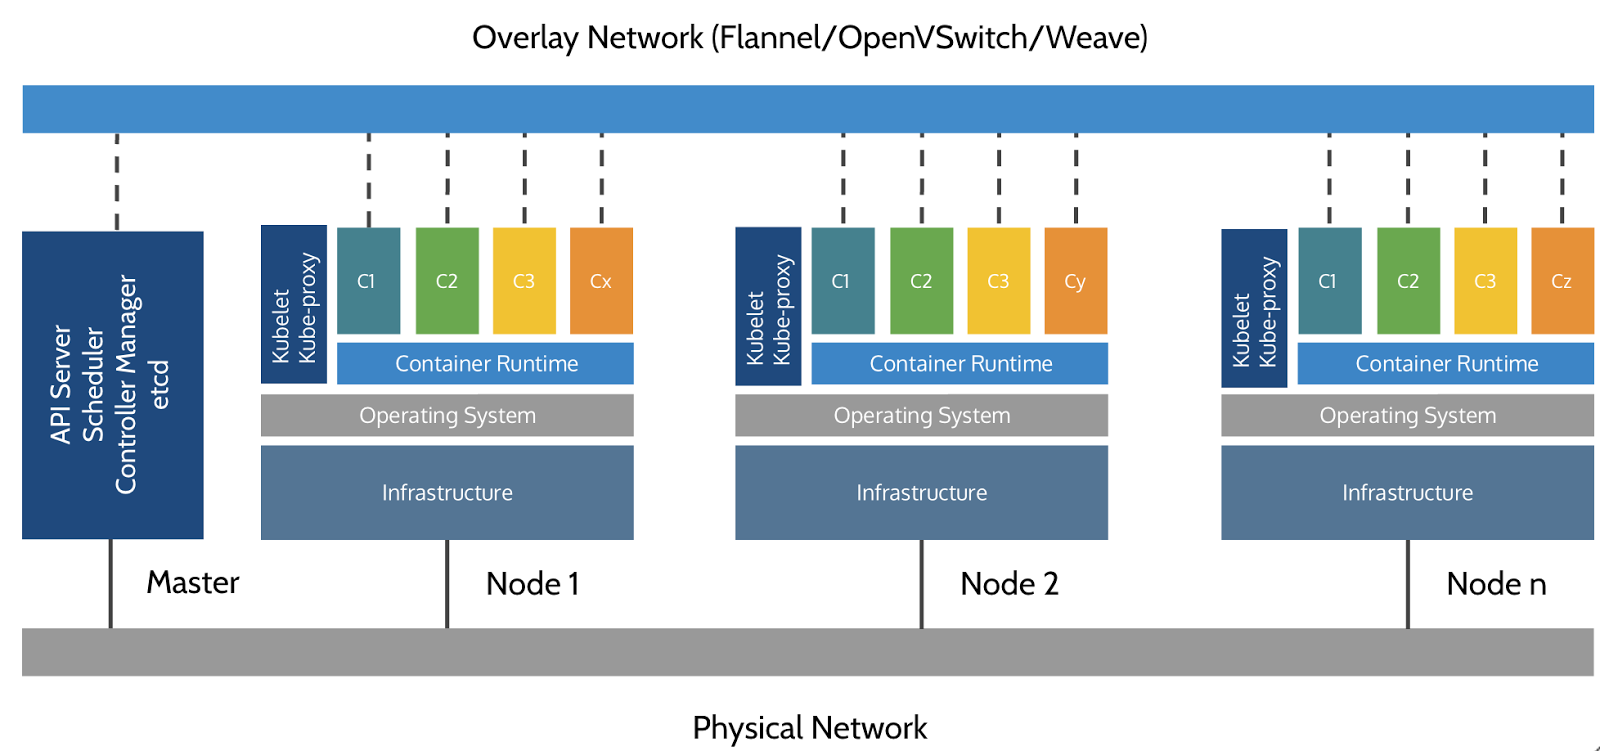 .debug[[k8s/concepts-k8s.md](https://github.com/BretFisher/kubernetes-mastery/tree/mastery/slides/k8s/concepts-k8s.md)] --- ## Credits - The first schema is a Kubernetes cluster with storage backed by multi-path iSCSI (Courtesy of [Yongbok Kim](https://www.yongbok.net/blog/)) - The second one is a simplified representation of a Kubernetes cluster (Courtesy of [Imesh Gunaratne](https://medium.com/containermind/a-reference-architecture-for-deploying-wso2-middleware-on-kubernetes-d4dee7601e8e)) .debug[[k8s/concepts-k8s.md](https://github.com/BretFisher/kubernetes-mastery/tree/mastery/slides/k8s/concepts-k8s.md)] --- ## Kubernetes architecture: the nodes - The nodes executing our containers run a collection of services: - a container Engine (typically Docker) - kubelet (the "node agent") - kube-proxy (a necessary but not sufficient network component) - Nodes were formerly called "minions" (You might see that word in older articles or documentation) .debug[[k8s/concepts-k8s.md](https://github.com/BretFisher/kubernetes-mastery/tree/mastery/slides/k8s/concepts-k8s.md)] --- ## Kubernetes architecture: the control plane - The Kubernetes logic (its "brains") is a collection of services: - the API server (our point of entry to everything!) - core services like the scheduler and controller manager - `etcd` (a highly available key/value store; the "database" of Kubernetes) - Together, these services form the control plane of our cluster - The control plane is also called the "master" .debug[[k8s/concepts-k8s.md](https://github.com/BretFisher/kubernetes-mastery/tree/mastery/slides/k8s/concepts-k8s.md)] --- class: pic 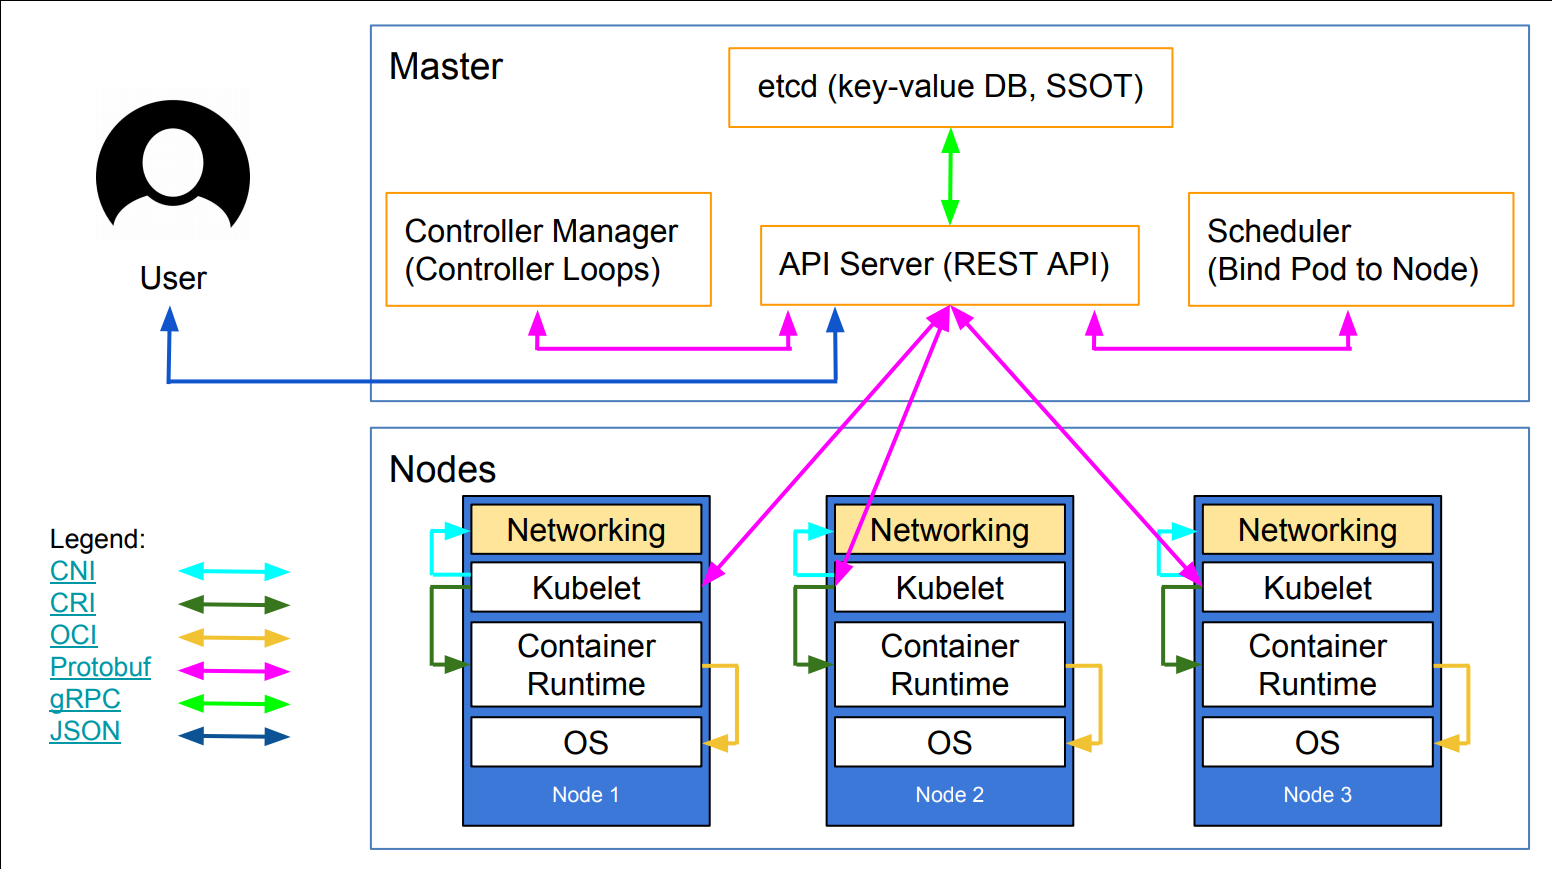 .debug[[k8s/concepts-k8s.md](https://github.com/BretFisher/kubernetes-mastery/tree/mastery/slides/k8s/concepts-k8s.md)] --- class: extra-details ## Running the control plane on special nodes - It is common to reserve a dedicated node for the control plane (Except for single-node development clusters, like when using minikube) - This node is then called a "master" (Yes, this is ambiguous: is the "master" a node, or the whole control plane?) - Normal applications are restricted from running on this node (By using a mechanism called ["taints"](https://kubernetes.io/docs/concepts/configuration/taint-and-toleration/)) - When high availability is required, each service of the control plane must be resilient - The control plane is then replicated on multiple nodes (This is sometimes called a "multi-master" setup) .debug[[k8s/concepts-k8s.md](https://github.com/BretFisher/kubernetes-mastery/tree/mastery/slides/k8s/concepts-k8s.md)] --- class: extra-details ## Running the control plane outside containers - The services of the control plane can run in or out of containers - For instance: since `etcd` is a critical service, some people deploy it directly on a dedicated cluster (without containers) (This is illustrated on the first "super complicated" schema) - In some hosted Kubernetes offerings (e.g. AKS, GKE, EKS), the control plane is invisible (We only "see" a Kubernetes API endpoint) - In that case, there is no "master node" *For this reason, it is more accurate to say "control plane" rather than "master."* .debug[[k8s/concepts-k8s.md](https://github.com/BretFisher/kubernetes-mastery/tree/mastery/slides/k8s/concepts-k8s.md)] --- class: extra-details ## How many nodes should a cluster have? - There is no particular constraint (no need to have an odd number of nodes for quorum) - A cluster can have zero node (but then it won't be able to start any pods) - For testing and development, having a single node is fine - For production, make sure that you have extra capacity (so that your workload still fits if you lose a node or a group of nodes) - Kubernetes is tested with [up to 5000 nodes](https://kubernetes.io/docs/setup/best-practices/cluster-large/) (however, running a cluster of that size requires a lot of tuning) .debug[[k8s/concepts-k8s.md](https://github.com/BretFisher/kubernetes-mastery/tree/mastery/slides/k8s/concepts-k8s.md)] --- class: extra-details ## Do we need to run Docker at all? No! -- - By default, Kubernetes uses the Docker Engine to run containers - We can leverage other pluggable runtimes through the *Container Runtime Interface* - <del>We could also use `rkt` ("Rocket") from CoreOS</del> (deprecated) .debug[[k8s/concepts-k8s.md](https://github.com/BretFisher/kubernetes-mastery/tree/mastery/slides/k8s/concepts-k8s.md)] --- class: extra-details ## Some runtimes available through CRI - [containerd](https://github.com/containerd/containerd/blob/master/README.md) - maintained by Docker, IBM, and community - used by Docker Engine, microk8s, k3s, GKE; also standalone - comes with its own CLI, `ctr` - [CRI-O](https://github.com/cri-o/cri-o/blob/master/README.md): - maintained by Red Hat, SUSE, and community - used by OpenShift and Kubic - designed specifically as a minimal runtime for Kubernetes - [And more](https://kubernetes.io/docs/setup/production-environment/container-runtimes/) .debug[[k8s/concepts-k8s.md](https://github.com/BretFisher/kubernetes-mastery/tree/mastery/slides/k8s/concepts-k8s.md)] --- class: extra-details ## Do we need to run Docker at all? Yes! -- - In this workshop, we run our app on a single node first - We will need to build images and ship them around - We can do these things without Docker <br/> (and get diagnosed with NIH¹ syndrome) - Docker is still the most stable container engine today <br/> (but other options are maturing very quickly) .footnote[¹[Not Invented Here](https://en.wikipedia.org/wiki/Not_invented_here)] .debug[[k8s/concepts-k8s.md](https://github.com/BretFisher/kubernetes-mastery/tree/mastery/slides/k8s/concepts-k8s.md)] --- class: extra-details ## Do we need to run Docker at all? - On our development environments, CI pipelines ... : *Yes, almost certainly* - On our production servers: *Yes (today)* *Probably not (in the future)* .footnote[More information about CRI [on the Kubernetes blog](https://kubernetes.io/blog/2016/12/container-runtime-interface-cri-in-kubernetes)] .debug[[k8s/concepts-k8s.md](https://github.com/BretFisher/kubernetes-mastery/tree/mastery/slides/k8s/concepts-k8s.md)] --- ## Interacting with Kubernetes - We will interact with our Kubernetes cluster through the Kubernetes API - The Kubernetes API is (mostly) RESTful - It allows us to create, read, update, delete *resources* - A few common resource types are: - node (a machine — physical or virtual — in our cluster) - pod (group of containers running together on a node) - service (stable network endpoint to connect to one or multiple containers) .debug[[k8s/concepts-k8s.md](https://github.com/BretFisher/kubernetes-mastery/tree/mastery/slides/k8s/concepts-k8s.md)] --- class: pic  .debug[[k8s/concepts-k8s.md](https://github.com/BretFisher/kubernetes-mastery/tree/mastery/slides/k8s/concepts-k8s.md)] --- ## Scaling - How would we scale the pod shown on the previous slide? - **Do** create additional pods - each pod can be on a different node - each pod will have its own IP address - **Do not** add more NGINX containers in the pod - all the NGINX containers would be on the same node - they would all have the same IP address <br/>(resulting in `Address alreading in use` errors) .debug[[k8s/concepts-k8s.md](https://github.com/BretFisher/kubernetes-mastery/tree/mastery/slides/k8s/concepts-k8s.md)] --- ## Together or separate - Should we put e.g. a web application server and a cache together? <br/> ("cache" being something like e.g. Memcached or Redis) - Putting them **in the same pod** means: - they have to be scaled together - they can communicate very efficiently over `localhost` - Putting them **in different pods** means: - they can be scaled separately - they must communicate over remote IP addresses <br/>(incurring more latency, lower performance) - Both scenarios can make sense, depending on our goals .debug[[k8s/concepts-k8s.md](https://github.com/BretFisher/kubernetes-mastery/tree/mastery/slides/k8s/concepts-k8s.md)] --- ## Credits - The first diagram is courtesy of Lucas Käldström, in [this presentation](https://speakerdeck.com/luxas/kubeadm-cluster-creation-internals-from-self-hosting-to-upgradability-and-ha) - it's one of the best Kubernetes architecture diagrams available! - The second diagram is courtesy of Weave Works - a *pod* can have multiple containers working together - IP addresses are associated with *pods*, not with individual containers Both diagrams used with permission. .debug[[k8s/concepts-k8s.md](https://github.com/BretFisher/kubernetes-mastery/tree/mastery/slides/k8s/concepts-k8s.md)] --- class: pic .interstitial[] --- name: toc-first-contact-with-kubectl class: title First contact with `kubectl` .nav[ [Previous section](#toc-kubernetes-concepts) | [Back to table of contents](#toc-chapter-2) | [Next section](#toc-running-our-first-containers-on-kubernetes) ] .debug[(automatically generated title slide)] --- # First contact with `kubectl` - `kubectl` is (almost) the only tool we'll need to talk to Kubernetes - It is a rich CLI tool around the Kubernetes API (Everything you can do with `kubectl`, you can do directly with the API) -- - On our machines, there is a `~/.kube/config` file with: - the Kubernetes API address - the path to our TLS certificates used to authenticate - You can also use the `--kubeconfig` flag to pass a config file - Or directly `--server`, `--user`, etc. -- - `kubectl` can be pronounced "Cube C T L", "Cube cuttle", "Cube cuddle"... - I'll be using the official name "Cube Control" 😎 .debug[[k8s/kubectlget.md](https://github.com/BretFisher/kubernetes-mastery/tree/mastery/slides/k8s/kubectlget.md)] --- class: extra-details ## `kubectl` is the new SSH - We often start managing servers with SSH (installing packages, troubleshooting ...) - At scale, it becomes tedious, repetitive, error-prone - Instead, we use config management, central logging, etc. - In many cases, we still need SSH: - as the underlying access method (e.g. Ansible) - to debug tricky scenarios - to inspect and poke at things .debug[[k8s/kubectlget.md](https://github.com/BretFisher/kubernetes-mastery/tree/mastery/slides/k8s/kubectlget.md)] --- class: extra-details ## The parallel with `kubectl` - We often start managing Kubernetes clusters with `kubectl` (deploying applications, troubleshooting ...) - At scale (with many applications or clusters), it becomes tedious, repetitive, error-prone - Instead, we use automated pipelines, observability tooling, etc. - In many cases, we still need `kubectl`: - to debug tricky scenarios - to inspect and poke at things - The Kubernetes API is always the underlying access method .debug[[k8s/kubectlget.md](https://github.com/BretFisher/kubernetes-mastery/tree/mastery/slides/k8s/kubectlget.md)] --- ## `kubectl get` - Let's look at our `Node` resources with `kubectl get`! .exercise[ - Look at the composition of our cluster: ```bash kubectl get node ``` - These commands are equivalent: ```bash kubectl get no kubectl get node kubectl get nodes ``` ] .debug[[k8s/kubectlget.md](https://github.com/BretFisher/kubernetes-mastery/tree/mastery/slides/k8s/kubectlget.md)] --- ## Obtaining machine-readable output - `kubectl get` can output JSON, YAML, or be directly formatted .exercise[ - Give us more info about the nodes: ```bash kubectl get nodes -o wide ``` - Let's have some YAML: ```bash kubectl get no -o yaml ``` See that `kind: List` at the end? It's the type of our result! ] .debug[[k8s/kubectlget.md](https://github.com/BretFisher/kubernetes-mastery/tree/mastery/slides/k8s/kubectlget.md)] --- ## (Ab)using `kubectl` and `jq` - It's super easy to build custom reports .exercise[ - Show the capacity of all our nodes as a stream of JSON objects: ```bash kubectl get nodes -o json | jq ".items[] | {name:.metadata.name} + .status.capacity" ``` ] .debug[[k8s/kubectlget.md](https://github.com/BretFisher/kubernetes-mastery/tree/mastery/slides/k8s/kubectlget.md)] --- ## Viewing details - We can use `kubectl get -o yaml` to see all available details - However, YAML output is often simultaneously too much and not enough - For instance, `kubectl get node node1 -o yaml` is: - too much information (e.g.: list of images available on this node) - not enough information (e.g.: doesn't show pods running on this node) - difficult to read for a human operator - For a comprehensive overview, we can use `kubectl describe` instead .debug[[k8s/kubectlget.md](https://github.com/BretFisher/kubernetes-mastery/tree/mastery/slides/k8s/kubectlget.md)] --- ## `kubectl describe` - `kubectl describe` needs a resource type and (optionally) a resource name - It is possible to provide a resource name *prefix* (all matching objects will be displayed) - `kubectl describe` will retrieve some extra information about the resource .exercise[ - Look at the information available for *your node name* with one of the following: ```bash kubectl describe node/<node> kubectl describe node <node> ``` ] (We should notice a bunch of control plane pods.) .debug[[k8s/kubectlget.md](https://github.com/BretFisher/kubernetes-mastery/tree/mastery/slides/k8s/kubectlget.md)] --- class: extra-details ## Exploring types and definitions - We can list all available resource types by running `kubectl api-resources` <br/> (In Kubernetes 1.10 and prior, this command used to be `kubectl get`) - We can view the definition for a resource type with: ```bash kubectl explain type ``` - We can view the definition of a field in a resource, for instance: ```bash kubectl explain node.spec ``` - Or get the list of all fields and sub-fields: ```bash kubectl explain node --recursive ``` .debug[[k8s/kubectlget.md](https://github.com/BretFisher/kubernetes-mastery/tree/mastery/slides/k8s/kubectlget.md)] --- class: extra-details ## Introspection vs. documentation - We can access the same information by reading the [API documentation](https://kubernetes.io/docs/reference/#api-reference) - The API documentation is usually easier to read, but: - it won't show custom types (like Custom Resource Definitions) - we need to make sure that we look at the correct version - `kubectl api-resources` and `kubectl explain` perform *introspection* (they communicate with the API server and obtain the exact type definitions) .debug[[k8s/kubectlget.md](https://github.com/BretFisher/kubernetes-mastery/tree/mastery/slides/k8s/kubectlget.md)] --- ## Type names - The most common resource names have three forms: - singular (e.g. `node`, `service`, `deployment`) - plural (e.g. `nodes`, `services`, `deployments`) - short (e.g. `no`, `svc`, `deploy`) - Some resources do not have a short name - `Endpoints` only have a plural form (because even a single `Endpoints` resource is actually a list of endpoints) .debug[[k8s/kubectlget.md](https://github.com/BretFisher/kubernetes-mastery/tree/mastery/slides/k8s/kubectlget.md)] --- ## More `get` commands: Services - A *service* is a stable endpoint to connect to "something" (In the initial proposal, they were called "portals") .exercise[ - List the services on our cluster with one of these commands: ```bash kubectl get services kubectl get svc ``` ] -- There is already one service on our cluster: the Kubernetes API itself. .debug[[k8s/kubectlget.md](https://github.com/BretFisher/kubernetes-mastery/tree/mastery/slides/k8s/kubectlget.md)] --- class: not-mastery ## ClusterIP services - A `ClusterIP` service is internal, available from the cluster only - This is useful for introspection from within containers .exercise[ - Try to connect to the API: ```bash curl -k https://`10.96.0.1` ``` - `-k` is used to skip certificate verification - Make sure to replace 10.96.0.1 with the CLUSTER-IP shown by `kubectl get svc` ] The error that we see is expected: the Kubernetes API requires authentication. .debug[[k8s/kubectlget.md](https://github.com/BretFisher/kubernetes-mastery/tree/mastery/slides/k8s/kubectlget.md)] --- ## More `get` commands: Listing running containers - Containers are manipulated through *pods* - A pod is a group of containers: - running together (on the same node) - sharing resources (RAM, CPU; but also network, volumes) .exercise[ - List pods on our cluster: ```bash kubectl get pods ``` ] -- *Where are the pods that we saw just a moment earlier?!?* .debug[[k8s/kubectlget.md](https://github.com/BretFisher/kubernetes-mastery/tree/mastery/slides/k8s/kubectlget.md)] --- ## Namespaces - Namespaces allow us to segregate resources .exercise[ - List the namespaces on our cluster with one of these commands: ```bash kubectl get namespaces kubectl get namespace kubectl get ns ``` ] -- *You know what ... This `kube-system` thing looks suspicious.* *In fact, I'm pretty sure it showed up earlier, when we did:* `kubectl describe node <node-name>` .debug[[k8s/kubectlget.md](https://github.com/BretFisher/kubernetes-mastery/tree/mastery/slides/k8s/kubectlget.md)] --- ## Accessing namespaces - By default, `kubectl` uses the `default` namespace - We can see resources in all namespaces with `--all-namespaces` .exercise[ - List the pods in all namespaces: ```bash kubectl get pods --all-namespaces ``` - Since Kubernetes 1.14, we can also use `-A` as a shorter version: ```bash kubectl get pods -A ``` ] *Here are our system pods!* .debug[[k8s/kubectlget.md](https://github.com/BretFisher/kubernetes-mastery/tree/mastery/slides/k8s/kubectlget.md)] --- ## What are all these control plane pods? - `etcd` is our etcd server - `kube-apiserver` is the API server - `kube-controller-manager` and `kube-scheduler` are other control plane components - `coredns` provides DNS-based service discovery ([replacing kube-dns as of 1.11](https://kubernetes.io/blog/2018/07/10/coredns-ga-for-kubernetes-cluster-dns/)) - `kube-proxy` is the (per-node) component managing port mappings and such - `<net name>` is the optional (per-node) component managing the network overlay - the `READY` column indicates the number of containers in each pod - Note: this only shows containers, you won't see host svcs (e.g. microk8s) - Also Note: you may see different namespaces depending on setup .debug[[k8s/kubectlget.md](https://github.com/BretFisher/kubernetes-mastery/tree/mastery/slides/k8s/kubectlget.md)] --- ## Scoping another namespace - We can also look at a different namespace (other than `default`) .exercise[ - List only the pods in the `kube-system` namespace: ```bash kubectl get pods --namespace=kube-system kubectl get pods -n kube-system ``` ] .debug[[k8s/kubectlget.md](https://github.com/BretFisher/kubernetes-mastery/tree/mastery/slides/k8s/kubectlget.md)] --- ## Namespaces and other `kubectl` commands - We can use `-n`/`--namespace` with almost every `kubectl` command - Example: - `kubectl create --namespace=X` to create something in namespace X - We can use `-A`/`--all-namespaces` with most commands that manipulate multiple objects - Examples: - `kubectl delete` can delete resources across multiple namespaces - `kubectl label` can add/remove/update labels across multiple namespaces .debug[[k8s/kubectlget.md](https://github.com/BretFisher/kubernetes-mastery/tree/mastery/slides/k8s/kubectlget.md)] --- class: extra-details ## What about `kube-public`? .exercise[ - List the pods in the `kube-public` namespace: ```bash kubectl -n kube-public get pods ``` ] Nothing! `kube-public` is created by our installer & [used for security bootstrapping](https://kubernetes.io/blog/2017/01/stronger-foundation-for-creating-and-managing-kubernetes-clusters). .debug[[k8s/kubectlget.md](https://github.com/BretFisher/kubernetes-mastery/tree/mastery/slides/k8s/kubectlget.md)] --- class: extra-details ## Exploring `kube-public` - The only interesting object in `kube-public` is a ConfigMap named `cluster-info` .exercise[ - List ConfigMap objects: ```bash kubectl -n kube-public get configmaps ``` - Inspect `cluster-info`: ```bash kubectl -n kube-public get configmap cluster-info -o yaml ``` ] Note the `selfLink` URI: `/api/v1/namespaces/kube-public/configmaps/cluster-info` We can use that (later in `kubectl context` lectures)! .debug[[k8s/kubectlget.md](https://github.com/BretFisher/kubernetes-mastery/tree/mastery/slides/k8s/kubectlget.md)] --- class: extra-details, not-mastery ## Accessing `cluster-info` - Earlier, when trying to access the API server, we got a `Forbidden` message - But `cluster-info` is readable by everyone (even without authentication) .exercise[ - Retrieve `cluster-info`: ```bash curl -k https://10.96.0.1/api/v1/namespaces/kube-public/configmaps/cluster-info ``` ] - We were able to access `cluster-info` (without auth) - It contains a `kubeconfig` file .debug[[k8s/kubectlget.md](https://github.com/BretFisher/kubernetes-mastery/tree/mastery/slides/k8s/kubectlget.md)] --- class: extra-details, not-mastery ## Retrieving `kubeconfig` - We can easily extract the `kubeconfig` file from this ConfigMap .exercise[ - Display the content of `kubeconfig`: ```bash curl -sk https://10.96.0.1/api/v1/namespaces/kube-public/configmaps/cluster-info \ | jq -r .data.kubeconfig ``` ] - This file holds the canonical address of the API server, and the public key of the CA - This file *does not* hold client keys or tokens - This is not sensitive information, but allows us to establish trust .debug[[k8s/kubectlget.md](https://github.com/BretFisher/kubernetes-mastery/tree/mastery/slides/k8s/kubectlget.md)] --- class: extra-details ## What about `kube-node-lease`? - Starting with Kubernetes 1.14, there is a `kube-node-lease` namespace (or in Kubernetes 1.13 if the NodeLease feature gate is enabled) - That namespace contains one Lease object per node - *Node leases* are a new way to implement node heartbeats (i.e. node regularly pinging the control plane to say "I'm alive!") - For more details, see [KEP-0009] or the [node controller documentation] [KEP-0009]: https://github.com/kubernetes/enhancements/blob/master/keps/sig-node/0009-node-heartbeat.md [node controller documentation]: https://kubernetes.io/docs/concepts/architecture/nodes/#node-controller .debug[[k8s/kubectlget.md](https://github.com/BretFisher/kubernetes-mastery/tree/mastery/slides/k8s/kubectlget.md)] --- ## Services - A *service* is a stable endpoint to connect to "something" (In the initial proposal, they were called "portals") .exercise[ - List the services on our cluster with one of these commands: ```bash kubectl get services kubectl get svc ``` ] -- There is already one service on our cluster: the Kubernetes API itself. .debug[[k8s/kubectlget.md](https://github.com/BretFisher/kubernetes-mastery/tree/mastery/slides/k8s/kubectlget.md)] --- ## ClusterIP services - A `ClusterIP` service is internal, available from the cluster only - This is useful for introspection from within containers .exercise[ - Try to connect to the API: ```bash curl -k https://`10.96.0.1` ``` - `-k` is used to skip certificate verification - Make sure to replace 10.96.0.1 with the CLUSTER-IP shown by `kubectl get svc` ] The command above should either time out, or show an authentication error. Why? .debug[[k8s/kubectlget.md](https://github.com/BretFisher/kubernetes-mastery/tree/mastery/slides/k8s/kubectlget.md)] --- ## Time out - Connections to ClusterIP services only work *from within the cluster* - If we are outside the cluster, the `curl` command will probably time out (Because the IP address, e.g. 10.96.0.1, isn't routed properly outside the cluster) - This is the case with most "real" Kubernetes clusters - To try the connection from within the cluster, we can use [shpod](https://github.com/jpetazzo/shpod) .debug[[k8s/kubectlget.md](https://github.com/BretFisher/kubernetes-mastery/tree/mastery/slides/k8s/kubectlget.md)] --- ## Authentication error This is what we should see when connecting from within the cluster: ```json $ curl -k https://10.96.0.1 { "kind": "Status", "apiVersion": "v1", "metadata": { }, "status": "Failure", "message": "forbidden: User \"system:anonymous\" cannot get path \"/\"", "reason": "Forbidden", "details": { }, "code": 403 } ``` .debug[[k8s/kubectlget.md](https://github.com/BretFisher/kubernetes-mastery/tree/mastery/slides/k8s/kubectlget.md)] --- ## Explanations - We can see `kind`, `apiVersion`, `metadata` - These are typical of a Kubernetes API reply - Because we *are* talking to the Kubernetes API - The Kubernetes API tells us "Forbidden" (because it requires authentication) - The Kubernetes API is reachable from within the cluster (many apps integrating with Kubernetes will use this) .debug[[k8s/kubectlget.md](https://github.com/BretFisher/kubernetes-mastery/tree/mastery/slides/k8s/kubectlget.md)] --- ## DNS integration - Each service also gets a DNS record - The Kubernetes DNS resolver is available *from within pods* (and sometimes, from within nodes, depending on configuration) - Code running in pods can connect to services using their name (e.g. https://kubernetes/...) .debug[[k8s/kubectlget.md](https://github.com/BretFisher/kubernetes-mastery/tree/mastery/slides/k8s/kubectlget.md)] --- class: pic .interstitial[] --- name: toc-running-our-first-containers-on-kubernetes class: title Running our first containers on Kubernetes .nav[ [Previous section](#toc-first-contact-with-kubectl) | [Back to table of contents](#toc-chapter-2) | [Next section](#toc-accessing-logs-from-the-cli) ] .debug[(automatically generated title slide)] --- # Running our first containers on Kubernetes - First things first: we cannot run a container -- - We are going to run a pod, and in that pod there will be a single container -- - In that container in the pod, we are going to run a simple `ping` command - Then we are going to start additional copies of the pod .debug[[k8s/kubectlrun.md](https://github.com/BretFisher/kubernetes-mastery/tree/mastery/slides/k8s/kubectlrun.md)] --- ## Starting a simple pod with `kubectl run` - We need to specify at least a *name* and the image we want to use .exercise[ - Let's ping the address of `localhost`, the loopback interface: ```bash kubectl run pingpong --image alpine ping 127.0.0.1 ``` <!-- ```hide kubectl wait deploy/pingpong --for condition=available``` --> ] -- (Starting with Kubernetes 1.12, we get a message telling us that `kubectl run` is deprecated. Let's ignore it for now.) .debug[[k8s/kubectlrun.md](https://github.com/BretFisher/kubernetes-mastery/tree/mastery/slides/k8s/kubectlrun.md)] --- ## Behind the scenes of `kubectl run` - Let's look at the resources that were created by `kubectl run` .exercise[ - List most resource types: ```bash kubectl get all ``` ] -- We should see the following things: - `deployment.apps/pingpong` (the *deployment* that we just created) - `replicaset.apps/pingpong-xxxxxxxxxx` (a *replica set* created by the deployment) - `pod/pingpong-xxxxxxxxxx-yyyyy` (a *pod* created by the replica set) Note: as of 1.10.1, resource types are displayed in more detail. .debug[[k8s/kubectlrun.md](https://github.com/BretFisher/kubernetes-mastery/tree/mastery/slides/k8s/kubectlrun.md)] --- ## What are these different things? - A *deployment* is a high-level construct - allows scaling, rolling updates, rollbacks - multiple deployments can be used together to implement a [canary deployment](https://kubernetes.io/docs/concepts/cluster-administration/manage-deployment/#canary-deployments) - delegates pods management to *replica sets* - A *replica set* is a low-level construct - makes sure that a given number of identical pods are running - allows scaling - rarely used directly - Note: A *replication controller* is the deprecated predecessor of a replica set .debug[[k8s/kubectlrun.md](https://github.com/BretFisher/kubernetes-mastery/tree/mastery/slides/k8s/kubectlrun.md)] --- ## Our `pingpong` deployment - `kubectl run` created a *deployment*, `deployment.apps/pingpong` ``` NAME DESIRED CURRENT UP-TO-DATE AVAILABLE AGE deployment.apps/pingpong 1 1 1 1 10m ``` - That deployment created a *replica set*, `replicaset.apps/pingpong-xxxxxxxxxx` ``` NAME DESIRED CURRENT READY AGE replicaset.apps/pingpong-7c8bbcd9bc 1 1 1 10m ``` - That replica set created a *pod*, `pod/pingpong-xxxxxxxxxx-yyyyy` ``` NAME READY STATUS RESTARTS AGE pod/pingpong-7c8bbcd9bc-6c9qz 1/1 Running 0 10m ``` - We'll see later how these folks play together for: - scaling, high availability, rolling updates .debug[[k8s/kubectlrun.md](https://github.com/BretFisher/kubernetes-mastery/tree/mastery/slides/k8s/kubectlrun.md)] --- ## Viewing container output - Let's use the `kubectl logs` command - We will pass either a *pod name*, or a *type/name* (E.g. if we specify a deployment or replica set, it will get the first pod in it) - Unless specified otherwise, it will only show logs of the first container in the pod (Good thing there's only one in ours!) .exercise[ - View the result of our `ping` command: ```bash kubectl logs deploy/pingpong ``` ] .debug[[k8s/kubectlrun.md](https://github.com/BretFisher/kubernetes-mastery/tree/mastery/slides/k8s/kubectlrun.md)] --- ## Streaming logs in real time - Just like `docker logs`, `kubectl logs` supports convenient options: - `-f`/`--follow` to stream logs in real time (à la `tail -f`) - `--tail` to indicate how many lines you want to see (from the end) - `--since` to get logs only after a given timestamp .exercise[ - View the latest logs of our `ping` command: ```bash kubectl logs deploy/pingpong --tail 1 --follow ``` - Leave that command running, so that we can keep an eye on these logs <!-- ```wait seq=3``` ```tmux split-pane -h``` --> ] .debug[[k8s/kubectlrun.md](https://github.com/BretFisher/kubernetes-mastery/tree/mastery/slides/k8s/kubectlrun.md)] --- ## Scaling our application - We can create additional copies of our container (I mean, our pod) with `kubectl scale` .exercise[ - Scale our `pingpong` deployment: ```bash kubectl scale deploy/pingpong --replicas 3 ``` - Note that this command does exactly the same thing: ```bash kubectl scale deployment pingpong --replicas 3 ``` ] Note: what if we tried to scale `replicaset.apps/pingpong-xxxxxxxxxx`? We could! But the *deployment* would notice it right away, and scale back to the initial level. .debug[[k8s/kubectlrun.md](https://github.com/BretFisher/kubernetes-mastery/tree/mastery/slides/k8s/kubectlrun.md)] --- ## Log streaming - Let's look again at the output of `kubectl logs` (the one we started before scaling up) - `kubectl logs` shows us one line per second - We could expect 3 lines per second (since we should now have 3 pods running `ping`) - Let's try to figure out what's happening! .debug[[k8s/kubectlrun.md](https://github.com/BretFisher/kubernetes-mastery/tree/mastery/slides/k8s/kubectlrun.md)] --- ## Streaming logs of multiple pods - What happens if we restart `kubectl logs`? .exercise[ - Interrupt `kubectl logs` (with Ctrl-C) <!-- ```tmux last-pane``` ```key ^C``` --> - Restart it: ```bash kubectl logs deploy/pingpong --tail 1 --follow ``` <!-- ```wait using pod/pingpong-``` ```tmux last-pane``` --> ] `kubectl logs` will warn us that multiple pods were found, and that it's showing us only one of them. Let's leave `kubectl logs` running while we keep exploring. .debug[[k8s/kubectlrun.md](https://github.com/BretFisher/kubernetes-mastery/tree/mastery/slides/k8s/kubectlrun.md)] --- ## Resilience - The *deployment* `pingpong` watches its *replica set* - The *replica set* ensures that the right number of *pods* are running - What happens if pods disappear? .exercise[ - In a separate window, watch the list of pods: ```bash watch kubectl get pods ``` <!-- ```wait Every 2.0s``` ```tmux split-pane -v``` --> - Destroy the pod currently shown by `kubectl logs`: ``` kubectl delete pod pingpong-xxxxxxxxxx-yyyyy ``` <!-- ```tmux select-pane -t 0``` ```copy pingpong-[^-]*-.....``` ```tmux last-pane``` ```keys kubectl delete pod ``` ```paste``` ```key ^J``` ```check``` ```key ^D``` ```tmux select-pane -t 1``` ```key ^C``` ```key ^D``` --> ] .debug[[k8s/kubectlrun.md](https://github.com/BretFisher/kubernetes-mastery/tree/mastery/slides/k8s/kubectlrun.md)] --- ## What happened? - `kubectl delete pod` terminates the pod gracefully (sending it the TERM signal and waiting for it to shutdown) - As soon as the pod is in "Terminating" state, the Replica Set replaces it - But we can still see the output of the "Terminating" pod in `kubectl logs` - Until 30 seconds later, when the grace period expires - The pod is then killed, and `kubectl logs` exits .debug[[k8s/kubectlrun.md](https://github.com/BretFisher/kubernetes-mastery/tree/mastery/slides/k8s/kubectlrun.md)] --- ## What if we wanted something different? - What if we wanted to start a "one-shot" container that *doesn't* get restarted? - We could use `kubectl run --restart=OnFailure` or `kubectl run --restart=Never` - These commands would create *jobs* or *pods* instead of *deployments* - Under the hood, `kubectl run` invokes "generators" to create resource descriptions - We could also write these resource descriptions ourselves (typically in YAML), <br/>and create them on the cluster with `kubectl apply -f` (discussed later) - With `kubectl run --schedule=...`, we can also create *cronjobs* .debug[[k8s/kubectlrun.md](https://github.com/BretFisher/kubernetes-mastery/tree/mastery/slides/k8s/kubectlrun.md)] --- ## Scheduling periodic background work - A Cron Job is a job that will be executed at specific intervals (the name comes from the traditional cronjobs executed by the UNIX crond) - It requires a *schedule*, represented as five space-separated fields: - minute [0,59] - hour [0,23] - day of the month [1,31] - month of the year [1,12] - day of the week ([0,6] with 0=Sunday) - `*` means "all valid values"; `/N` means "every N" - Example: `*/3 * * * *` means "every three minutes" .debug[[k8s/kubectlrun.md](https://github.com/BretFisher/kubernetes-mastery/tree/mastery/slides/k8s/kubectlrun.md)] --- ## Creating a Cron Job - Let's create a simple job to be executed every three minutes - Cron Jobs need to terminate, otherwise they'd run forever .exercise[ - Create the Cron Job: ```bash kubectl run every3mins --schedule="*/3 * * * *" --restart=OnFailure \ --image=alpine sleep 10 ``` - Check the resource that was created: ```bash kubectl get cronjobs ``` ] .debug[[k8s/kubectlrun.md](https://github.com/BretFisher/kubernetes-mastery/tree/mastery/slides/k8s/kubectlrun.md)] --- ## Cron Jobs in action - At the specified schedule, the Cron Job will create a Job - The Job will create a Pod - The Job will make sure that the Pod completes (re-creating another one if it fails, for instance if its node fails) .exercise[ - Check the Jobs that are created: ```bash kubectl get jobs ``` ] (It will take a few minutes before the first job is scheduled.) .debug[[k8s/kubectlrun.md](https://github.com/BretFisher/kubernetes-mastery/tree/mastery/slides/k8s/kubectlrun.md)] --- ## What about that deprecation warning? - As we can see from the previous slide, `kubectl run` can do many things - The exact type of resource created is not obvious - To make things more explicit, it is better to use `kubectl create`: - `kubectl create deployment` to create a deployment - `kubectl create job` to create a job - `kubectl create cronjob` to run a job periodically <br/>(since Kubernetes 1.14) - Eventually, `kubectl run` will be used only to start one-shot pods (see https://github.com/kubernetes/kubernetes/pull/68132) .debug[[k8s/kubectlrun.md](https://github.com/BretFisher/kubernetes-mastery/tree/mastery/slides/k8s/kubectlrun.md)] --- ## Various ways of creating resources - `kubectl run` - easy way to get started - versatile - `kubectl create <resource>` - explicit, but lacks some features - can't create a CronJob before Kubernetes 1.14 - can't pass command-line arguments to deployments - `kubectl create -f foo.yaml` or `kubectl apply -f foo.yaml` - all features are available - requires writing YAML .debug[[k8s/kubectlrun.md](https://github.com/BretFisher/kubernetes-mastery/tree/mastery/slides/k8s/kubectlrun.md)] --- ## Viewing logs of multiple pods - When we specify a deployment name, only one single pod's logs are shown - We can view the logs of multiple pods by specifying a *selector* - A selector is a logic expression using *labels* - Conveniently, when you `kubectl run somename`, the associated objects have a `run=somename` label .exercise[ - View the last line of log from all pods with the `run=pingpong` label: ```bash kubectl logs -l run=pingpong --tail 1 ``` ] .debug[[k8s/kubectlrun.md](https://github.com/BretFisher/kubernetes-mastery/tree/mastery/slides/k8s/kubectlrun.md)] --- ### Streaming logs of multiple pods - Can we stream the logs of all our `pingpong` pods? .exercise[ - Combine `-l` and `-f` flags: ```bash kubectl logs -l run=pingpong --tail 1 -f ``` <!-- ```wait seq=``` ```key ^C``` --> ] *Note: combining `-l` and `-f` is only possible since Kubernetes 1.14!* *Let's try to understand why ...* .debug[[k8s/kubectlrun.md](https://github.com/BretFisher/kubernetes-mastery/tree/mastery/slides/k8s/kubectlrun.md)] --- class: extra-details ### Streaming logs of many pods - Let's see what happens if we try to stream the logs for more than 5 pods .exercise[ - Scale up our deployment: ```bash kubectl scale deployment pingpong --replicas=8 ``` - Stream the logs: ```bash kubectl logs -l run=pingpong --tail 1 -f ``` <!-- ```wait error:``` --> ] We see a message like the following one: ``` error: you are attempting to follow 8 log streams, but maximum allowed concurency is 5, use --max-log-requests to increase the limit ``` .debug[[k8s/kubectlrun.md](https://github.com/BretFisher/kubernetes-mastery/tree/mastery/slides/k8s/kubectlrun.md)] --- class: extra-details ## Why can't we stream the logs of many pods? - `kubectl` opens one connection to the API server per pod - For each pod, the API server opens one extra connection to the corresponding kubelet - If there are 1000 pods in our deployment, that's 1000 inbound + 1000 outbound connections on the API server - This could easily put a lot of stress on the API server - Prior Kubernetes 1.14, it was decided to *not* allow multiple connections - From Kubernetes 1.14, it is allowed, but limited to 5 connections (this can be changed with `--max-log-requests`) - For more details about the rationale, see [PR #67573](https://github.com/kubernetes/kubernetes/pull/67573) .debug[[k8s/kubectlrun.md](https://github.com/BretFisher/kubernetes-mastery/tree/mastery/slides/k8s/kubectlrun.md)] --- ## Shortcomings of `kubectl logs` - We don't see which pod sent which log line - If pods are restarted / replaced, the log stream stops - If new pods are added, we don't see their logs - To stream the logs of multiple pods, we need to write a selector - There are external tools to address these shortcomings (e.g.: [Stern](https://github.com/stern/stern)) .debug[[k8s/kubectlrun.md](https://github.com/BretFisher/kubernetes-mastery/tree/mastery/slides/k8s/kubectlrun.md)] --- class: extra-details ## `kubectl logs -l ... --tail N` - If we run this with Kubernetes 1.12, the last command shows multiple lines - This is a regression when `--tail` is used together with `-l`/`--selector` - It always shows the last 10 lines of output for each container (instead of the number of lines specified on the command line) - The problem was fixed in Kubernetes 1.13 *See [#70554](https://github.com/kubernetes/kubernetes/issues/70554) for details.* .debug[[k8s/kubectlrun.md](https://github.com/BretFisher/kubernetes-mastery/tree/mastery/slides/k8s/kubectlrun.md)] --- class: extra-details ## Party tricks involving IP addresses - It is possible to specify an IP address with less than 4 bytes (example: `127.1`) - Zeroes are then inserted in the middle - As a result, `127.1` expands to `127.0.0.1` - So we can `ping 127.1` to ping `localhost`! (See [this blog post](https://ma.ttias.be/theres-more-than-one-way-to-write-an-ip-address/ ) for more details.) .debug[[k8s/kubectlrun.md](https://github.com/BretFisher/kubernetes-mastery/tree/mastery/slides/k8s/kubectlrun.md)] --- class: extra-details ## More party tricks with IP addresses - We can also ping `1.1` - `1.1` will expand to `1.0.0.1` - This is one of the addresses of Cloudflare's [public DNS resolver](https://blog.cloudflare.com/announcing-1111/) - This is a quick way to check connectivity (if we can reach 1.1, we probably have internet access) .debug[[k8s/kubectlrun.md](https://github.com/BretFisher/kubernetes-mastery/tree/mastery/slides/k8s/kubectlrun.md)] --- class: pic .interstitial[] --- name: toc-accessing-logs-from-the-cli class: title Accessing logs from the CLI .nav[ [Previous section](#toc-running-our-first-containers-on-kubernetes) | [Back to table of contents](#toc-chapter-2) | [Next section](#toc-declarative-vs-imperative) ] .debug[(automatically generated title slide)] --- # Accessing logs from the CLI - The `kubectl logs` command has limitations: - it cannot stream logs from multiple pods at a time - when showing logs from multiple pods, it mixes them all together - We are going to see how to do it better .debug[[k8s/logs-cli.md](https://github.com/BretFisher/kubernetes-mastery/tree/mastery/slides/k8s/logs-cli.md)] --- ## Doing it manually - We *could* (if we were so inclined) write a program or script that would: - take a selector as an argument - enumerate all pods matching that selector (with `kubectl get -l ...`) - fork one `kubectl logs --follow ...` command per container - annotate the logs (the output of each `kubectl logs ...` process) with their origin - preserve ordering by using `kubectl logs --timestamps ...` and merge the output -- - We *could* do it, but thankfully, others did it for us already! .debug[[k8s/logs-cli.md](https://github.com/BretFisher/kubernetes-mastery/tree/mastery/slides/k8s/logs-cli.md)] --- ## Stern [Stern](https://github.com/stern/stern) is an open source project originally by [Wercker](http://www.wercker.com/). From the README: *Stern allows you to tail multiple pods on Kubernetes and multiple containers within the pod. Each result is color coded for quicker debugging.* *The query is a regular expression so the pod name can easily be filtered and you don't need to specify the exact id (for instance omitting the deployment id). If a pod is deleted it gets removed from tail and if a new pod is added it automatically gets tailed.* Exactly what we need! .debug[[k8s/logs-cli.md](https://github.com/BretFisher/kubernetes-mastery/tree/mastery/slides/k8s/logs-cli.md)] --- ## Checking if Stern is installed - Run `stern` (without arguments) to check if it's installed: ``` $ stern Tail multiple pods and containers from Kubernetes Usage: stern pod-query [flags] ``` - If it's missing, let's see how to install it .debug[[k8s/logs-cli.md](https://github.com/BretFisher/kubernetes-mastery/tree/mastery/slides/k8s/logs-cli.md)] --- ## Installing Stern - Stern is written in Go - Go programs are usually very easy to install (no dependencies, extra libraries to install, etc) - Binary releases are available [on GitHub][stern-releases] - Stern is also available through most package managers (e.g. on macOS, we can `brew install stern` or `sudo port install stern`) [stern-releases]: https://github.com/stern/stern/releases .debug[[k8s/logs-cli.md](https://github.com/BretFisher/kubernetes-mastery/tree/mastery/slides/k8s/logs-cli.md)] --- ## Using Stern - There are two ways to specify the pods whose logs we want to see: - `-l` followed by a selector expression (like with many `kubectl` commands) - with a "pod query," i.e. a regex used to match pod names - These two ways can be combined if necessary .lab[ - View the logs for all the pingpong containers: ```bash stern pingpong ``` <!-- ```wait seq=``` ```key ^C``` --> ] .debug[[k8s/logs-cli.md](https://github.com/BretFisher/kubernetes-mastery/tree/mastery/slides/k8s/logs-cli.md)] --- ## Stern convenient options - The `--tail N` flag shows the last `N` lines for each container (Instead of showing the logs since the creation of the container) - The `-t` / `--timestamps` flag shows timestamps - The `--all-namespaces` flag is self-explanatory .lab[ - View what's up with the `weave` system containers: ```bash stern --tail 1 --timestamps --all-namespaces weave ``` <!-- ```wait weave-npc``` ```key ^C``` --> ] .debug[[k8s/logs-cli.md](https://github.com/BretFisher/kubernetes-mastery/tree/mastery/slides/k8s/logs-cli.md)] --- ## Using Stern with a selector - When specifying a selector, we can omit the value for a label - This will match all objects having that label (regardless of the value) - Everything created with `kubectl run` has a label `run` - Everything created with `kubectl create deployment` has a label `app` - We can use that property to view the logs of all the pods created with `kubectl create deployment` .lab[ - View the logs for all the things started with `kubectl create deployment`: ```bash stern -l app ``` <!-- ```wait seq=``` ```key ^C``` --> ] ??? :EN:- Viewing pod logs from the CLI :FR:- Consulter les logs des pods depuis la CLI .debug[[k8s/logs-cli.md](https://github.com/BretFisher/kubernetes-mastery/tree/mastery/slides/k8s/logs-cli.md)] --- class: pic .interstitial[] --- name: toc-declarative-vs-imperative class: title Declarative vs imperative .nav[ [Previous section](#toc-accessing-logs-from-the-cli) | [Back to table of contents](#toc-chapter-2) | [Next section](#toc-kubernetes-network-model) ] .debug[(automatically generated title slide)] --- # Declarative vs imperative - Our container orchestrator puts a very strong emphasis on being *declarative* - Declarative: *I would like a cup of tea.* - Imperative: *Boil some water. Pour it in a teapot. Add tea leaves. Steep for a while. Serve in a cup.* -- - Declarative seems simpler at first ... -- - ... As long as you know how to brew tea .debug[[shared/declarative.md](https://github.com/BretFisher/kubernetes-mastery/tree/mastery/slides/shared/declarative.md)] --- ## Declarative vs imperative - What declarative would really be: *I want a cup of tea, obtained by pouring an infusion¹ of tea leaves in a cup.* -- *¹An infusion is obtained by letting the object steep a few minutes in hot² water.* -- *²Hot liquid is obtained by pouring it in an appropriate container³ and setting it on a stove.* -- *³Ah, finally, containers! Something we know about. Let's get to work, shall we?* -- .footnote[Did you know there was an [ISO standard](https://en.wikipedia.org/wiki/ISO_3103) specifying how to brew tea?] .debug[[shared/declarative.md](https://github.com/BretFisher/kubernetes-mastery/tree/mastery/slides/shared/declarative.md)] --- ## Declarative vs imperative - Imperative systems: - simpler - if a task is interrupted, we have to restart from scratch - Declarative systems: - if a task is interrupted (or if we show up to the party half-way through), we can figure out what's missing and do only what's necessary - we need to be able to *observe* the system - ... and compute a "diff" between *what we have* and *what we want* .debug[[shared/declarative.md](https://github.com/BretFisher/kubernetes-mastery/tree/mastery/slides/shared/declarative.md)] --- ## Declarative vs imperative in Kubernetes - With Kubernetes, we cannot say: "run this container" - All we can do is write a *spec* and push it to the API server (for example, by creating a resource like a Pod or a Deployment) - The API server will validate that spec (and reject it if it's invalid) - Then it will store it in etcd - A *controller* will "notice" that spec and act upon it .debug[[k8s/declarative.md](https://github.com/BretFisher/kubernetes-mastery/tree/mastery/slides/k8s/declarative.md)] --- ## Reconciling state - Watch for the `spec` fields in the YAML files later! - The *spec* describes *how we want the thing to be* - Kubernetes will *reconcile* the current state with the spec <br/>(technically, this is done by a number of *controllers*) - When we want to change some resource, we update the *spec* - Kubernetes will then *converge* that resource .debug[[k8s/declarative.md](https://github.com/BretFisher/kubernetes-mastery/tree/mastery/slides/k8s/declarative.md)] --- ## 19,000 words They say, "a picture is worth one thousand words." The following 19 slides show what really happens when we run: ```bash kubectl run web --image=nginx --replicas=3 ``` .debug[[k8s/deploymentslideshow.md](https://github.com/BretFisher/kubernetes-mastery/tree/mastery/slides/k8s/deploymentslideshow.md)] --- class: pic  .debug[[k8s/deploymentslideshow.md](https://github.com/BretFisher/kubernetes-mastery/tree/mastery/slides/k8s/deploymentslideshow.md)] --- class: pic  .debug[[k8s/deploymentslideshow.md](https://github.com/BretFisher/kubernetes-mastery/tree/mastery/slides/k8s/deploymentslideshow.md)] --- class: pic  .debug[[k8s/deploymentslideshow.md](https://github.com/BretFisher/kubernetes-mastery/tree/mastery/slides/k8s/deploymentslideshow.md)] --- class: pic  .debug[[k8s/deploymentslideshow.md](https://github.com/BretFisher/kubernetes-mastery/tree/mastery/slides/k8s/deploymentslideshow.md)] --- class: pic  .debug[[k8s/deploymentslideshow.md](https://github.com/BretFisher/kubernetes-mastery/tree/mastery/slides/k8s/deploymentslideshow.md)] --- class: pic  .debug[[k8s/deploymentslideshow.md](https://github.com/BretFisher/kubernetes-mastery/tree/mastery/slides/k8s/deploymentslideshow.md)] --- class: pic  .debug[[k8s/deploymentslideshow.md](https://github.com/BretFisher/kubernetes-mastery/tree/mastery/slides/k8s/deploymentslideshow.md)] --- class: pic  .debug[[k8s/deploymentslideshow.md](https://github.com/BretFisher/kubernetes-mastery/tree/mastery/slides/k8s/deploymentslideshow.md)] --- class: pic  .debug[[k8s/deploymentslideshow.md](https://github.com/BretFisher/kubernetes-mastery/tree/mastery/slides/k8s/deploymentslideshow.md)] --- class: pic  .debug[[k8s/deploymentslideshow.md](https://github.com/BretFisher/kubernetes-mastery/tree/mastery/slides/k8s/deploymentslideshow.md)] --- class: pic  .debug[[k8s/deploymentslideshow.md](https://github.com/BretFisher/kubernetes-mastery/tree/mastery/slides/k8s/deploymentslideshow.md)] --- class: pic  .debug[[k8s/deploymentslideshow.md](https://github.com/BretFisher/kubernetes-mastery/tree/mastery/slides/k8s/deploymentslideshow.md)] --- class: pic  .debug[[k8s/deploymentslideshow.md](https://github.com/BretFisher/kubernetes-mastery/tree/mastery/slides/k8s/deploymentslideshow.md)] --- class: pic  .debug[[k8s/deploymentslideshow.md](https://github.com/BretFisher/kubernetes-mastery/tree/mastery/slides/k8s/deploymentslideshow.md)] --- class: pic  .debug[[k8s/deploymentslideshow.md](https://github.com/BretFisher/kubernetes-mastery/tree/mastery/slides/k8s/deploymentslideshow.md)] --- class: pic  .debug[[k8s/deploymentslideshow.md](https://github.com/BretFisher/kubernetes-mastery/tree/mastery/slides/k8s/deploymentslideshow.md)] --- class: pic  .debug[[k8s/deploymentslideshow.md](https://github.com/BretFisher/kubernetes-mastery/tree/mastery/slides/k8s/deploymentslideshow.md)] --- class: pic  .debug[[k8s/deploymentslideshow.md](https://github.com/BretFisher/kubernetes-mastery/tree/mastery/slides/k8s/deploymentslideshow.md)] --- class: pic  .debug[[k8s/deploymentslideshow.md](https://github.com/BretFisher/kubernetes-mastery/tree/mastery/slides/k8s/deploymentslideshow.md)] --- class: pic .interstitial[] --- name: toc-kubernetes-network-model class: title Kubernetes network model .nav[ [Previous section](#toc-declarative-vs-imperative) | [Back to table of contents](#toc-chapter-3) | [Next section](#toc-exposing-containers) ] .debug[(automatically generated title slide)] --- # Kubernetes network model - TL,DR: *Our cluster (nodes and pods) is one big flat IP network.* -- - In detail: - all nodes must be able to reach each other, without NAT - all pods must be able to reach each other, without NAT - pods and nodes must be able to reach each other, without NAT - each pod is aware of its IP address (no NAT) - pod IP addresses are assigned by the network implementation - Kubernetes doesn't mandate any particular implementation .debug[[k8s/kubenet.md](https://github.com/BretFisher/kubernetes-mastery/tree/mastery/slides/k8s/kubenet.md)] --- ## Kubernetes network model: the good - Everything can reach everything - No address translation - No port translation - No new protocol - The network implementation can decide how to allocate addresses - IP addresses don't have to be "portable" from a node to another (For example, We can use a subnet per node and use a simple routed topology) - The specification is simple enough to allow many various implementations .debug[[k8s/kubenet.md](https://github.com/BretFisher/kubernetes-mastery/tree/mastery/slides/k8s/kubenet.md)] --- ## Kubernetes network model: the less good - Everything can reach everything - if you want security, you need to add network policies - the network implementation you use needs to support them - There are literally dozens of implementations out there (15 are listed in the Kubernetes documentation) - Pods have level 3 (IP) connectivity, but *services* are level 4 (TCP or UDP) (Services map to a single UDP or TCP port; no port ranges or arbitrary IP packets) - `kube-proxy` is on the data path when connecting to a pod or container, <br/>and it's not particularly fast (relies on userland proxying or iptables) .debug[[k8s/kubenet.md](https://github.com/BretFisher/kubernetes-mastery/tree/mastery/slides/k8s/kubenet.md)] --- ## Kubernetes network model: in practice - The nodes we are using have been set up to use kubenet, Calico, or something else - Don't worry about the warning about `kube-proxy` performance - Unless you: - routinely saturate 10G network interfaces - count packet rates in millions per second - run high-traffic VOIP or gaming platforms - do weird things that involve millions of simultaneous connections <br/>(in which case you're already familiar with kernel tuning) - If necessary, there are alternatives to `kube-proxy`; e.g. [`kube-router`](https://www.kube-router.io) .debug[[k8s/kubenet.md](https://github.com/BretFisher/kubernetes-mastery/tree/mastery/slides/k8s/kubenet.md)] --- class: extra-details ## The Container Network Interface (CNI) - Most Kubernetes clusters use CNI "plugins" to implement networking - When a pod is created, Kubernetes delegates the network setup to these plugins (it can be a single plugin, or a combination of plugins, each doing one task) - Typically, CNI plugins will: - allocate an IP address (by calling an IPAM plugin) - add a network interface into the pod's network namespace - configure the interface as well as required routes, etc. .debug[[k8s/kubenet.md](https://github.com/BretFisher/kubernetes-mastery/tree/mastery/slides/k8s/kubenet.md)] --- class: extra-details ## Multiple moving parts - The "pod-to-pod network" or "pod network": - provides communication between pods and nodes - is generally implemented with CNI plugins - The "pod-to-service network": - provides internal communication and load balancing - is generally implemented with kube-proxy (or maybe kube-router) - Network policies: - provide firewalling and isolation - can be bundled with the "pod network" or provided by another component .debug[[k8s/kubenet.md](https://github.com/BretFisher/kubernetes-mastery/tree/mastery/slides/k8s/kubenet.md)] --- class: extra-details ## Even more moving parts - Inbound traffic can be handled by multiple components: - something like kube-proxy or kube-router (for NodePort services) - load balancers (ideally, connected to the pod network) - It is possible to use multiple pod networks in parallel (with "meta-plugins" like CNI-Genie or Multus) - Some solutions can fill multiple roles (e.g. kube-router can be set up to provide the pod network and/or network policies and/or replace kube-proxy) .debug[[k8s/kubenet.md](https://github.com/BretFisher/kubernetes-mastery/tree/mastery/slides/k8s/kubenet.md)] --- class: pic .interstitial[] --- name: toc-exposing-containers class: title Exposing containers .nav[ [Previous section](#toc-kubernetes-network-model) | [Back to table of contents](#toc-chapter-3) | [Next section](#toc-shipping-images-with-a-registry) ] .debug[(automatically generated title slide)] --- # Exposing containers - We can connect to our pods using their IP address - Then we need to figure out a lot of things: - how do we look up the IP address of the pod(s)? - how do we connect from outside the cluster? - how do we load balance traffic? - what if a pod fails? - Kubernetes has a resource type named *Service* - Services address all these questions! .debug[[k8s/kubectlexpose.md](https://github.com/BretFisher/kubernetes-mastery/tree/mastery/slides/k8s/kubectlexpose.md)] --- ## Services in a nutshell - Services give us a *stable endpoint* to connect to a pod or a group of pods - An easy way to create a service is to use `kubectl expose` - If we have a deployment named `my-little-deploy`, we can run: `kubectl expose deployment my-little-deploy --port=80` ... and this will create a service with the same name (`my-little-deploy`) - Services are automatically added to an internal DNS zone (in the example above, our code can now connect to http://my-little-deploy/) .debug[[k8s/kubectlexpose.md](https://github.com/BretFisher/kubernetes-mastery/tree/mastery/slides/k8s/kubectlexpose.md)] --- ## Advantages of services - We don't need to look up the IP address of the pod(s) (we resolve the IP address of the service using DNS) - There are multiple service types; some of them allow external traffic (e.g. `LoadBalancer` and `NodePort`) - Services provide load balancing (for both internal and external traffic) - Service addresses are independent from pods' addresses (when a pod fails, the service seamlessly sends traffic to its replacement) .debug[[k8s/kubectlexpose.md](https://github.com/BretFisher/kubernetes-mastery/tree/mastery/slides/k8s/kubectlexpose.md)] --- ## Many kinds and flavors of service - There are different types of services: `ClusterIP`, `NodePort`, `LoadBalancer`, `ExternalName` - There are also *headless services* - Services can also have optional *external IPs* - There is also another resource type called *Ingress* (specifically for HTTP services) - Wow, that's a lot! Let's start with the basics ... .debug[[k8s/kubectlexpose.md](https://github.com/BretFisher/kubernetes-mastery/tree/mastery/slides/k8s/kubectlexpose.md)] --- ## `ClusterIP` - It's the default service type - A virtual IP address is allocated for the service (in an internal, private range; e.g. 10.96.0.0/12) - This IP address is reachable only from within the cluster (nodes and pods) - Our code can connect to the service using the original port number - Perfect for internal communication, within the cluster .debug[[k8s/kubectlexpose.md](https://github.com/BretFisher/kubernetes-mastery/tree/mastery/slides/k8s/kubectlexpose.md)] --- ## `LoadBalancer` - An external load balancer is allocated for the service (typically a cloud load balancer, e.g. ELB on AWS, GLB on GCE ...) - This is available only when the underlying infrastructure provides some kind of "load balancer as a service" - Each service of that type will typically cost a little bit of money (e.g. a few cents per hour on AWS or GCE) - Ideally, traffic would flow directly from the load balancer to the pods - In practice, it will often flow through a `NodePort` first .debug[[k8s/kubectlexpose.md](https://github.com/BretFisher/kubernetes-mastery/tree/mastery/slides/k8s/kubectlexpose.md)] --- ## `NodePort` - A port number is allocated for the service (by default, in the 30000-32767 range) - That port is made available *on all our nodes* and anybody can connect to it (we can connect to any node on that port to reach the service) - Our code needs to be changed to connect to that new port number - Under the hood: `kube-proxy` sets up a bunch of `iptables` rules on our nodes - Sometimes, it's the only available option for external traffic (e.g. most clusters deployed with kubeadm or on-premises) .debug[[k8s/kubectlexpose.md](https://github.com/BretFisher/kubernetes-mastery/tree/mastery/slides/k8s/kubectlexpose.md)] --- ## Running containers with open ports - Since `ping` doesn't have anything to connect to, we'll have to run something else - We could use the `nginx` official image, but ... ... we wouldn't be able to tell the backends from each other! - We are going to use `bretfisher/httpenv`, a tiny HTTP server written in Go - `bretfisher/httpenv` listens on port 8888 - It serves its environment variables in JSON format - The environment variables will include `HOSTNAME`, which will be the pod name (and therefore, will be different on each backend) .debug[[k8s/kubectlexpose.md](https://github.com/BretFisher/kubernetes-mastery/tree/mastery/slides/k8s/kubectlexpose.md)] --- ## Creating a deployment for our HTTP server - We *could* do `kubectl run httpenv --image=bretfisher/httpenv` ... - But since `kubectl run` is changing, let's see how to use `kubectl create` instead .exercise[ - In another window, watch the pods (to see when they are created): ```bash kubectl get pods -w ``` <!-- ```wait NAME``` ```tmux split-pane -h``` --> - Create a deployment for this very lightweight HTTP server: ```bash kubectl create deployment httpenv --image=bretfisher/httpenv ``` - Scale it to 10 replicas: ```bash kubectl scale deployment httpenv --replicas=10 ``` ] .debug[[k8s/kubectlexpose.md](https://github.com/BretFisher/kubernetes-mastery/tree/mastery/slides/k8s/kubectlexpose.md)] --- ## Exposing our deployment - We'll create a default `ClusterIP` service .exercise[ - Expose the HTTP port of our server: ```bash kubectl expose deployment httpenv --port 8888 ``` - Look up which IP address was allocated: ```bash kubectl get service ``` ] .debug[[k8s/kubectlexpose.md](https://github.com/BretFisher/kubernetes-mastery/tree/mastery/slides/k8s/kubectlexpose.md)] --- ## Services are layer 4 constructs - You can assign IP addresses to services, but they are still *layer 4* (i.e. a service is not an IP address; it's an IP address + protocol + port) - This is caused by the current implementation of `kube-proxy` (it relies on mechanisms that don't support layer 3) - As a result: you *have to* indicate the port number for your service (with some exceptions, like `ExternalName` or headless services, covered later) .debug[[k8s/kubectlexpose.md](https://github.com/BretFisher/kubernetes-mastery/tree/mastery/slides/k8s/kubectlexpose.md)] --- ## Testing our service - We will now send a few HTTP requests to our pods .exercise[ - Run [`shpod`](#shpod) if not on Linux host so we can access internal ClusterIP ```bash kubectl attach --namespace=shpod -ti shpod ``` - Let's obtain the IP address that was allocated for our service, *programmatically:* ```bash IP=$(kubectl get svc httpenv -o go-template --template '{{ .spec.clusterIP }}') ``` <!-- ```hide kubectl wait deploy httpenv --for condition=available``` ```key ^D``` ```key ^C``` --> - Send a few requests: ```bash curl http://$IP:8888/ ``` - Too much output? Filter it with `jq`: ```bash curl -s http://$IP:8888/ | jq .HOSTNAME ``` ] .debug[[k8s/kubectlexpose.md](https://github.com/BretFisher/kubernetes-mastery/tree/mastery/slides/k8s/kubectlexpose.md)] --- class: extra-details ## `ExternalName` - Services of type `ExternalName` are quite different - No load balancer (internal or external) is created - Only a DNS entry gets added to the DNS managed by Kubernetes - That DNS entry will just be a `CNAME` to a provided record Example: ```bash kubectl create service externalname k8s --external-name kubernetes.io ``` *Creates a CNAME `k8s` pointing to `kubernetes.io`* .debug[[k8s/kubectlexpose.md](https://github.com/BretFisher/kubernetes-mastery/tree/mastery/slides/k8s/kubectlexpose.md)] --- class: extra-details ## External IPs - We can add an External IP to a service, e.g.: ```bash kubectl expose deploy my-little-deploy --port=80 --external-ip=1.2.3.4 ``` - `1.2.3.4` should be the address of one of our nodes (it could also be a virtual address, service address, or VIP, shared by multiple nodes) - Connections to `1.2.3.4:80` will be sent to our service - External IPs will also show up on services of type `LoadBalancer` (they will be added automatically by the process provisioning the load balancer) .debug[[k8s/kubectlexpose.md](https://github.com/BretFisher/kubernetes-mastery/tree/mastery/slides/k8s/kubectlexpose.md)] --- class: extra-details ## Headless services - Sometimes, we want to access our scaled services directly: - if we want to save a tiny little bit of latency (typically less than 1ms) - if we need to connect over arbitrary ports (instead of a few fixed ones) - if we need to communicate over another protocol than UDP or TCP - if we want to decide how to balance the requests client-side - ... - In that case, we can use a "headless service" .debug[[k8s/kubectlexpose.md](https://github.com/BretFisher/kubernetes-mastery/tree/mastery/slides/k8s/kubectlexpose.md)] --- class: extra-details ## Creating a headless services - A headless service is obtained by setting the `clusterIP` field to `None` (Either with `--cluster-ip=None`, or by providing a custom YAML) - As a result, the service doesn't have a virtual IP address - Since there is no virtual IP address, there is no load balancer either - CoreDNS will return the pods' IP addresses as multiple `A` records - This gives us an easy way to discover all the replicas for a deployment .debug[[k8s/kubectlexpose.md](https://github.com/BretFisher/kubernetes-mastery/tree/mastery/slides/k8s/kubectlexpose.md)] --- class: extra-details ## Services and endpoints - A service has a number of "endpoints" - Each endpoint is a host + port where the service is available - The endpoints are maintained and updated automatically by Kubernetes .exercise[ - Check the endpoints that Kubernetes has associated with our `httpenv` service: ```bash kubectl describe service httpenv ``` ] In the output, there will be a line starting with `Endpoints:`. That line will list a bunch of addresses in `host:port` format. .debug[[k8s/kubectlexpose.md](https://github.com/BretFisher/kubernetes-mastery/tree/mastery/slides/k8s/kubectlexpose.md)] --- class: extra-details ## Viewing endpoint details - When we have many endpoints, our display commands truncate the list ```bash kubectl get endpoints ``` - If we want to see the full list, we can use a different output: ```bash kubectl get endpoints httpenv -o yaml ``` - These IP addresses should match the addresses of the corresponding pods: ```bash kubectl get pods -l app=httpenv -o wide ``` .debug[[k8s/kubectlexpose.md](https://github.com/BretFisher/kubernetes-mastery/tree/mastery/slides/k8s/kubectlexpose.md)] --- class: extra-details ## `endpoints` not `endpoint` - `endpoints` is the only resource that cannot be singular ```bash $ kubectl get endpoint error: the server doesn't have a resource type "endpoint" ``` - This is because the type itself is plural (unlike every other resource) - There is no `endpoint` object: `type Endpoints struct` - The type doesn't represent a single endpoint, but a list of endpoints .debug[[k8s/kubectlexpose.md](https://github.com/BretFisher/kubernetes-mastery/tree/mastery/slides/k8s/kubectlexpose.md)] --- class: extra-details ## The DNS zone - In the `kube-system` namespace, there should be a service named `kube-dns` - This is the internal DNS server that can resolve service names - The default domain name for the service we created is `default.svc.cluster.local` .exercise[ - Get the IP address of the internal DNS server: ```bash IP=$(kubectl -n kube-system get svc kube-dns -o jsonpath={.spec.clusterIP}) ``` - Resolve the cluster IP for the `httpenv` service: ```bash host httpenv.default.svc.cluster.local $IP ``` ] .debug[[k8s/kubectlexpose.md](https://github.com/BretFisher/kubernetes-mastery/tree/mastery/slides/k8s/kubectlexpose.md)] --- class: extra-details ## `Ingress` - Ingresses are another type (kind) of resource - They are specifically for HTTP services (not TCP or UDP) - They can also handle TLS certificates, URL rewriting ... - They require an *Ingress Controller* to function .debug[[k8s/kubectlexpose.md](https://github.com/BretFisher/kubernetes-mastery/tree/mastery/slides/k8s/kubectlexpose.md)] --- class: pic .interstitial[] --- name: toc-shipping-images-with-a-registry class: title Shipping images with a registry .nav[ [Previous section](#toc-exposing-containers) | [Back to table of contents](#toc-chapter-3) | [Next section](#toc-running-dockercoins-on-kubernetes) ] .debug[(automatically generated title slide)] --- # Shipping images with a registry - For development using Docker, it has *build*, *ship*, and *run* features - Now that we want to run on a cluster, things are different - Kubernetes doesn't have a *build* feature built-in - The way to ship (pull) images to Kubernetes is to use a registry .debug[[k8s/shippingimages.md](https://github.com/BretFisher/kubernetes-mastery/tree/mastery/slides/k8s/shippingimages.md)] --- ## How Docker registries work (a reminder) - What happens when we execute `docker run alpine` ? - If the Engine needs to pull the `alpine` image, it expands it into `library/alpine` - `library/alpine` is expanded into `index.docker.io/library/alpine` - The Engine communicates with `index.docker.io` to retrieve `library/alpine:latest` - To use something else than `index.docker.io`, we specify it in the image name - Examples: ```bash docker pull gcr.io/google-containers/alpine-with-bash:1.0 docker build -t registry.mycompany.io:5000/myimage:awesome . docker push registry.mycompany.io:5000/myimage:awesome ``` .debug[[k8s/shippingimages.md](https://github.com/BretFisher/kubernetes-mastery/tree/mastery/slides/k8s/shippingimages.md)] --- ## Building and shipping images - There are *many* options! - Manually: - build locally (with `docker build` or otherwise) - push to the registry - Automatically: - build and test locally - when ready, commit and push a code repository - the code repository notifies an automated build system - that system gets the code, builds it, pushes the image to the registry .debug[[k8s/shippingimages.md](https://github.com/BretFisher/kubernetes-mastery/tree/mastery/slides/k8s/shippingimages.md)] --- ## Which registry do we want to use? - There are SAAS products like Docker Hub, Quay, GitLab ... - Each major cloud provider has an option as well (ACR on Azure, ECR on AWS, GCR on Google Cloud...) -- - There are also commercial products to run our own registry (Docker Enterprise DTR, Quay, GitLab, JFrog Artifactory...) -- - And open source options, too! (Quay, Portus, OpenShift OCR, GitLab, Harbor, Kraken...) (I don't mention Docker Distribution here because it's too basic) -- - When picking a registry, pay attention to: - Its build system - Multi-user auth and mgmt (RBAC) - Storage features (replication, caching, garbage collection) .debug[[k8s/shippingimages.md](https://github.com/BretFisher/kubernetes-mastery/tree/mastery/slides/k8s/shippingimages.md)] --- ## Running DockerCoins on Kubernetes - Create one deployment for each component (hasher, redis, rng, webui, worker) - Expose deployments that need to accept connections (hasher, redis, rng, webui) - For redis, we can use the official redis image - For the 4 others, we need to build images and push them to some registry .debug[[k8s/shippingimages.md](https://github.com/BretFisher/kubernetes-mastery/tree/mastery/slides/k8s/shippingimages.md)] --- ## Self-hosting our registry *Note: this section shows how to run the Docker open source registry and use it to ship images on our cluster. While this method works fine, we recommend that you consider using one of the hosted, free automated build services instead. It will be much easier!* *If you need to run a registry on premises, this section gives you a starting point, but you will need to make a lot of changes so that the registry is secured, highly available, and so that your build pipeline is automated.* .debug[[k8s/buildshiprun-selfhosted.md](https://github.com/BretFisher/kubernetes-mastery/tree/mastery/slides/k8s/buildshiprun-selfhosted.md)] --- ## Using the open source registry - We need to run a `registry` container - It will store images and layers to the local filesystem <br/>(but you can add a config file to use S3, Swift, etc.) - Docker *requires* TLS when communicating with the registry - unless for registries on `127.0.0.0/8` (i.e. `localhost`) - or with the Engine flag `--insecure-registry` - Our strategy: publish the registry container on a NodePort, <br/>so that it's available through `127.0.0.1:xxxxx` on each node .debug[[k8s/buildshiprun-selfhosted.md](https://github.com/BretFisher/kubernetes-mastery/tree/mastery/slides/k8s/buildshiprun-selfhosted.md)] --- ## Deploying a self-hosted registry - We will deploy a registry container, and expose it with a NodePort .exercise[ - Create the registry service: ```bash kubectl create deployment registry --image=registry ``` - Expose it on a NodePort: ```bash kubectl expose deploy/registry --port=5000 --type=NodePort ``` ] .debug[[k8s/buildshiprun-selfhosted.md](https://github.com/BretFisher/kubernetes-mastery/tree/mastery/slides/k8s/buildshiprun-selfhosted.md)] --- ## Connecting to our registry - We need to find out which port has been allocated .exercise[ - View the service details: ```bash kubectl describe svc/registry ``` - Get the port number programmatically: ```bash NODEPORT=$(kubectl get svc/registry -o json | jq .spec.ports[0].nodePort) REGISTRY=127.0.0.1:$NODEPORT ``` ] .debug[[k8s/buildshiprun-selfhosted.md](https://github.com/BretFisher/kubernetes-mastery/tree/mastery/slides/k8s/buildshiprun-selfhosted.md)] --- ## Testing our registry - A convenient Docker registry API route to remember is `/v2/_catalog` .exercise[ <!-- ```hide kubectl wait deploy/registry --for condition=available```--> - View the repositories currently held in our registry: ```bash curl $REGISTRY/v2/_catalog ``` ] -- We should see: ```json {"repositories":[]} ``` .debug[[k8s/buildshiprun-selfhosted.md](https://github.com/BretFisher/kubernetes-mastery/tree/mastery/slides/k8s/buildshiprun-selfhosted.md)] --- ## Testing our local registry - We can retag a small image, and push it to the registry .exercise[ - Make sure we have the busybox image, and retag it: ```bash docker pull busybox docker tag busybox $REGISTRY/busybox ``` - Push it: ```bash docker push $REGISTRY/busybox ``` ] .debug[[k8s/buildshiprun-selfhosted.md](https://github.com/BretFisher/kubernetes-mastery/tree/mastery/slides/k8s/buildshiprun-selfhosted.md)] --- ## Checking again what's on our local registry - Let's use the same endpoint as before .exercise[ - Ensure that our busybox image is now in the local registry: ```bash curl $REGISTRY/v2/_catalog ``` ] The curl command should now output: ```json {"repositories":["busybox"]} ``` .debug[[k8s/buildshiprun-selfhosted.md](https://github.com/BretFisher/kubernetes-mastery/tree/mastery/slides/k8s/buildshiprun-selfhosted.md)] --- ## Building and pushing our images - We are going to use a convenient feature of Docker Compose .exercise[ - Go to the `stacks` directory: ```bash cd ~/container.training/stacks ``` - Build and push the images: ```bash export REGISTRY export TAG=v0.1 docker-compose -f dockercoins.yml build docker-compose -f dockercoins.yml push ``` ] Let's have a look at the `dockercoins.yml` file while this is building and pushing. .debug[[k8s/buildshiprun-selfhosted.md](https://github.com/BretFisher/kubernetes-mastery/tree/mastery/slides/k8s/buildshiprun-selfhosted.md)] --- ```yaml version: "3" services: rng: build: dockercoins/rng image: ${REGISTRY-127.0.0.1:5000}/rng:${TAG-latest} deploy: mode: global ... redis: image: redis ... worker: build: dockercoins/worker image: ${REGISTRY-127.0.0.1:5000}/worker:${TAG-latest} ... deploy: replicas: 10 ``` .warning[Just in case you were wondering ... Docker "services" are not Kubernetes "services".] .debug[[k8s/buildshiprun-selfhosted.md](https://github.com/BretFisher/kubernetes-mastery/tree/mastery/slides/k8s/buildshiprun-selfhosted.md)] --- class: extra-details ## Avoiding the `latest` tag .warning[Make sure that you've set the `TAG` variable properly!] - If you don't, the tag will default to `latest` - The problem with `latest`: nobody knows what it points to! - the latest commit in the repo? - the latest commit in some branch? (Which one?) - the latest tag? - some random version pushed by a random team member? - If you keep pushing the `latest` tag, how do you roll back? - Image tags should be meaningful, i.e. correspond to code branches, tags, or hashes .debug[[k8s/buildshiprun-selfhosted.md](https://github.com/BretFisher/kubernetes-mastery/tree/mastery/slides/k8s/buildshiprun-selfhosted.md)] --- ## Checking the content of the registry - All our images should now be in the registry .exercise[ - Re-run the same `curl` command as earlier: ```bash curl $REGISTRY/v2/_catalog ``` ] *In these slides, all the commands to deploy DockerCoins will use a $REGISTRY environment variable, so that we can quickly switch from the self-hosted registry to pre-built images hosted on the Docker Hub. So make sure that this $REGISTRY variable is set correctly when running the exercises!* .debug[[k8s/buildshiprun-selfhosted.md](https://github.com/BretFisher/kubernetes-mastery/tree/mastery/slides/k8s/buildshiprun-selfhosted.md)] --- ## Using images from the Docker Hub - For everyone's convenience, we took care of building DockerCoins images - We pushed these images to the DockerHub, under the [dockercoins](https://hub.docker.com/u/dockercoins) user - These images are *tagged* with a version number, `v0.1` - The full image names are therefore: - `dockercoins/hasher:v0.1` - `dockercoins/rng:v0.1` - `dockercoins/webui:v0.1` - `dockercoins/worker:v0.1` .debug[[k8s/buildshiprun-dockerhub.md](https://github.com/BretFisher/kubernetes-mastery/tree/mastery/slides/k8s/buildshiprun-dockerhub.md)] --- class: pic .interstitial[] --- name: toc-running-dockercoins-on-kubernetes class: title Running DockerCoins on Kubernetes .nav[ [Previous section](#toc-shipping-images-with-a-registry) | [Back to table of contents](#toc-chapter-3) | [Next section](#toc-deploying-with-yaml) ] .debug[(automatically generated title slide)] --- # Running DockerCoins on Kubernetes - We can now deploy our code (as well as a redis instance) .exercise[ - Deploy `redis`: ```bash kubectl create deployment redis --image=redis ``` - Deploy everything else: ```bash kubectl create deployment hasher --image=dockercoins/hasher:v0.1 kubectl create deployment rng --image=dockercoins/rng:v0.1 kubectl create deployment webui --image=dockercoins/webui:v0.1 kubectl create deployment worker --image=dockercoins/worker:v0.1 ``` ] .debug[[k8s/ourapponkube.md](https://github.com/BretFisher/kubernetes-mastery/tree/mastery/slides/k8s/ourapponkube.md)] --- class: extra-details, not-mastery ## Deploying other images - If we wanted to deploy images from another registry ... - ... Or with a different tag ... - ... We could use the following snippet: ```bash REGISTRY=dockercoins TAG=v0.1 for SERVICE in hasher rng webui worker; do kubectl create deployment $SERVICE --image=$REGISTRY/$SERVICE:$TAG done ``` .debug[[k8s/ourapponkube.md](https://github.com/BretFisher/kubernetes-mastery/tree/mastery/slides/k8s/ourapponkube.md)] --- ## Is this working? - After waiting for the deployment to complete, let's look at the logs! (Hint: use `kubectl get deploy -w` to watch deployment events) .exercise[ <!-- ```hide kubectl wait deploy/rng --for condition=available kubectl wait deploy/worker --for condition=available ``` --> - Look at some logs: ```bash kubectl logs deploy/rng kubectl logs deploy/worker ``` ] -- 🤔 `rng` is fine ... But not `worker`. -- 💡 Oh right! We forgot to `expose`. .debug[[k8s/ourapponkube.md](https://github.com/BretFisher/kubernetes-mastery/tree/mastery/slides/k8s/ourapponkube.md)] --- ## Connecting containers together - Three deployments need to be reachable by others: `hasher`, `redis`, `rng` - `worker` doesn't need to be exposed - `webui` will be dealt with later .exercise[ - Expose each deployment, specifying the right port: ```bash kubectl expose deployment redis --port 6379 kubectl expose deployment rng --port 80 kubectl expose deployment hasher --port 80 ``` ] .debug[[k8s/ourapponkube.md](https://github.com/BretFisher/kubernetes-mastery/tree/mastery/slides/k8s/ourapponkube.md)] --- ## Is this working yet? - The `worker` has an infinite loop, that retries 10 seconds after an error .exercise[ - Stream the worker's logs: ```bash kubectl logs deploy/worker --follow ``` (Give it about 10 seconds to recover) <!-- ```wait units of work done, updating hash counter``` ```key ^C``` --> ] -- We should now see the `worker`, well, working happily. .debug[[k8s/ourapponkube.md](https://github.com/BretFisher/kubernetes-mastery/tree/mastery/slides/k8s/ourapponkube.md)] --- ## Exposing services for external access - Now we would like to access the Web UI - We will expose it with a `NodePort` (just like we did for the registry) .exercise[ - Create a `NodePort` service for the Web UI: ```bash kubectl expose deploy/webui --type=NodePort --port=80 ``` - Check the port that was allocated: ```bash kubectl get svc ``` ] .debug[[k8s/ourapponkube.md](https://github.com/BretFisher/kubernetes-mastery/tree/mastery/slides/k8s/ourapponkube.md)] --- ## Accessing the web UI - We can now connect to *any node*, on the allocated node port, to view the web UI .exercise[ - Open the web UI in your browser (http://localhost:3xxxx/) <!-- ```open http://node1:3xxxx/``` --> ] -- Yes, this may take a little while to update. *(Narrator: it was DNS.)* -- *Alright, we're back to where we started, when we were running on a single node!* .debug[[k8s/ourapponkube.md](https://github.com/BretFisher/kubernetes-mastery/tree/mastery/slides/k8s/ourapponkube.md)] --- class: pic .interstitial[] --- name: toc-deploying-with-yaml class: title Deploying with YAML .nav[ [Previous section](#toc-running-dockercoins-on-kubernetes) | [Back to table of contents](#toc-chapter-3) | [Next section](#toc-setting-up-kubernetes) ] .debug[(automatically generated title slide)] --- # Deploying with YAML - So far, we created resources with the following commands: - `kubectl run` - `kubectl create deployment` - `kubectl expose` - We can also create resources directly with YAML manifests .debug[[k8s/yamldeploy.md](https://github.com/BretFisher/kubernetes-mastery/tree/mastery/slides/k8s/yamldeploy.md)] --- ## `kubectl apply` vs `create` - `kubectl create -f whatever.yaml` - creates resources if they don't exist - if resources already exist, don't alter them <br/>(and display error message) - `kubectl apply -f whatever.yaml` - creates resources if they don't exist - if resources already exist, update them <br/>(to match the definition provided by the YAML file) - stores the manifest as an *annotation* in the resource .debug[[k8s/yamldeploy.md](https://github.com/BretFisher/kubernetes-mastery/tree/mastery/slides/k8s/yamldeploy.md)] --- ## Creating multiple resources - The manifest can contain multiple resources separated by `---` ```yaml kind: ... apiVersion: ... metadata: name: ... ... spec: ... --- kind: ... apiVersion: ... metadata: name: ... ... spec: ... ``` .debug[[k8s/yamldeploy.md](https://github.com/BretFisher/kubernetes-mastery/tree/mastery/slides/k8s/yamldeploy.md)] --- ## Creating multiple resources - The manifest can also contain a list of resources ```yaml apiVersion: v1 kind: List items: - kind: ... apiVersion: ... ... - kind: ... apiVersion: ... ... ``` .debug[[k8s/yamldeploy.md](https://github.com/BretFisher/kubernetes-mastery/tree/mastery/slides/k8s/yamldeploy.md)] --- name: dockercoins ## Deploying DockerCoins with YAML - Here's a YAML manifest with all the resources for DockerCoins (Deployments and Services) - We can use it if we need to deploy or redeploy DockerCoins - Yes YAML file commands can use URL's! .exercise[ - Deploy or redeploy DockerCoins: ```bash kubectl apply -f https://k8smastery.com/dockercoins.yaml ``` ] .debug[[k8s/yamldeploy.md](https://github.com/BretFisher/kubernetes-mastery/tree/mastery/slides/k8s/yamldeploy.md)] --- ## `Apply` errors for `create` or `run` resources - Note the warnings if you already had the resources created - This is because we didn't use `apply` before - This is OK for us learning, so ignore the warnings - Generally in production you want to stick with one method or the other .debug[[k8s/yamldeploy.md](https://github.com/BretFisher/kubernetes-mastery/tree/mastery/slides/k8s/yamldeploy.md)] --- ## Deleting resources - We can also use a YAML file to *delete* resources - `kubectl delete -f ...` will delete all the resources mentioned in a YAML file (useful to clean up everything that was created by `kubectl apply -f ...`) - The definitions of the resources don't matter (just their `kind`, `apiVersion`, and `name`) .debug[[k8s/yamldeploy.md](https://github.com/BretFisher/kubernetes-mastery/tree/mastery/slides/k8s/yamldeploy.md)] --- ## Pruning¹ resources - We can also tell `kubectl` to remove old resources - This is done with `kubectl apply -f ... --prune` - It will remove resources that don't exist in the YAML file(s) - But only if they were created with `kubectl apply` in the first place (technically, if they have an annotation `kubectl.kubernetes.io/last-applied-configuration`) .footnote[¹If English is not your first language: *to prune* means to remove dead or overgrown branches in a tree, to help it to grow.] .debug[[k8s/yamldeploy.md](https://github.com/BretFisher/kubernetes-mastery/tree/mastery/slides/k8s/yamldeploy.md)] --- ## YAML as source of truth - Imagine the following workflow: - do not use `kubectl run`, `kubectl create deployment`, `kubectl expose` ... - define everything with YAML - `kubectl apply -f ... --prune --all` that YAML - keep that YAML under version control - enforce all changes to go through that YAML (e.g. with pull requests) - Our version control system now has a full history of what we deploy - Compares to "Infrastructure-as-Code", but for app deployments .debug[[k8s/yamldeploy.md](https://github.com/BretFisher/kubernetes-mastery/tree/mastery/slides/k8s/yamldeploy.md)] --- class: extra-details ## Specifying the namespace - When creating resources from YAML manifests, the namespace is optional - If we specify a namespace: - resources are created in the specified namespace - this is typical for things deployed only once per cluster - example: system components, cluster add-ons ... - If we don't specify a namespace: - resources are created in the current namespace - this is typical for things that may be deployed multiple times - example: applications (production, staging, feature branches ...) .debug[[k8s/yamldeploy.md](https://github.com/BretFisher/kubernetes-mastery/tree/mastery/slides/k8s/yamldeploy.md)] --- class: pic .interstitial[] --- name: toc-setting-up-kubernetes class: title Setting up Kubernetes .nav[ [Previous section](#toc-deploying-with-yaml) | [Back to table of contents](#toc-chapter-4) | [Next section](#toc-the-kubernetes-dashboard) ] .debug[(automatically generated title slide)] --- # Setting up Kubernetes - How did we set up these Kubernetes clusters that we're using? -- <!-- ##VERSION## --> - We used `kubeadm` on freshly installed VM instances running Ubuntu LTS 1. Install Docker 2. Install Kubernetes packages 3. Run `kubeadm init` on the first node (it deploys the control plane on that node) 4. Set up Weave (the overlay network) <br/> (that step is just one `kubectl apply` command; discussed later) 5. Run `kubeadm join` on the other nodes (with the token produced by `kubeadm init`) 6. Copy the configuration file generated by `kubeadm init` - Check the [prepare VMs README](https://github.com/jpetazzo/container.training/blob/master/prepare-vms/README.md) for more details .debug[[k8s/setup-k8s.md](https://github.com/BretFisher/kubernetes-mastery/tree/mastery/slides/k8s/setup-k8s.md)] --- ## `kubeadm` drawbacks - Doesn't set up Docker or any other container engine - Doesn't set up the overlay network - Doesn't set up multi-master (no high availability) -- (At least ... not yet! Though it's [experimental in 1.12](https://kubernetes.io/docs/setup/independent/high-availability/).) -- - "It's still twice as many steps as setting up a Swarm cluster 😕" -- Jérôme .debug[[k8s/setup-k8s.md](https://github.com/BretFisher/kubernetes-mastery/tree/mastery/slides/k8s/setup-k8s.md)] --- ## Other deployment options - [AKS](https://azure.microsoft.com/services/kubernetes-service/): managed Kubernetes on Azure - [GKE](https://cloud.google.com/kubernetes-engine/): managed Kubernetes on Google Cloud - [EKS](https://aws.amazon.com/eks/), [eksctl](https://eksctl.io/): managed Kubernetes on AWS - [kops](https://github.com/kubernetes/kops): customizable deployments on AWS, Digital Ocean, GCE (beta), vSphere (alpha) - [minikube](https://kubernetes.io/docs/setup/minikube/), [kubespawn](https://github.com/kinvolk/kube-spawn), [Docker Desktop](https://docs.docker.com/docker-for-mac/kubernetes/), [kind](https://kind.sigs.k8s.io): for local development - [kubicorn](https://github.com/kubicorn/kubicorn), the [Cluster API](https://blogs.vmware.com/cloudnative/2019/03/14/what-and-why-of-cluster-api/): deploy your clusters declaratively, "the Kubernetes way" .debug[[k8s/setup-k8s.md](https://github.com/BretFisher/kubernetes-mastery/tree/mastery/slides/k8s/setup-k8s.md)] --- ## Even more deployment options - If you like Ansible: [kubespray](https://github.com/kubernetes-incubator/kubespray) - If you like Terraform: [typhoon](https://github.com/poseidon/typhoon) - If you like Terraform and Puppet: [tarmak](https://github.com/jetstack/tarmak) - You can also learn how to install every component manually, with the excellent tutorial [Kubernetes The Hard Way](https://github.com/kelseyhightower/kubernetes-the-hard-way) *Kubernetes The Hard Way is optimized for learning, which means taking the long route to ensure you understand each task required to bootstrap a Kubernetes cluster.* - There are also many commercial options available! - For a longer list, check the Kubernetes documentation: <br/> it has a great guide to [pick the right solution](https://kubernetes.io/docs/setup/#production-environment) to set up Kubernetes. .debug[[k8s/setup-k8s.md](https://github.com/BretFisher/kubernetes-mastery/tree/mastery/slides/k8s/setup-k8s.md)] --- class: pic .interstitial[] --- name: toc-the-kubernetes-dashboard class: title The Kubernetes Dashboard .nav[ [Previous section](#toc-setting-up-kubernetes) | [Back to table of contents](#toc-chapter-4) | [Next section](#toc-security-implications-of-kubectl-apply) ] .debug[(automatically generated title slide)] --- # The Kubernetes Dashboard - Kubernetes resources can also be viewed with an official web UI - That dashboard is usually exposed over HTTPS (this requires obtaining a proper TLS certificate) - Dashboard users need to authenticate - We are going to take a *dangerous* shortcut .debug[[k8s/dashboard.md](https://github.com/BretFisher/kubernetes-mastery/tree/mastery/slides/k8s/dashboard.md)] --- ## The insecure method - We could (and should) use [Let's Encrypt](https://letsencrypt.org/) ... - ... but we don't want to deal with TLS certificates - We could (and should) learn how authentication and authorization work ... - ... but we will use a guest account with admin access instead .footnote[.warning[Yes, this will open our cluster to all kinds of shenanigans. Don't do this at home.]] .debug[[k8s/dashboard.md](https://github.com/BretFisher/kubernetes-mastery/tree/mastery/slides/k8s/dashboard.md)] --- ## Running a very insecure dashboard - We are going to deploy that dashboard with *one single command* - This command will create all the necessary resources (the dashboard itself, the HTTP wrapper, the admin/guest account) - All these resources are defined in a YAML file - All we have to do is load that YAML file with with `kubectl apply -f` .exercise[ - Create all the dashboard resources, with the following command: ```bash kubectl apply -f https://k8smastery.com/insecure-dashboard.yaml ``` ] .debug[[k8s/dashboard.md](https://github.com/BretFisher/kubernetes-mastery/tree/mastery/slides/k8s/dashboard.md)] --- ## Connecting to the dashboard .exercise[ - Check which port the dashboard is on: ```bash kubectl get svc dashboard ``` ] You'll want the `3xxxx` port. .exercise[ - Connect to http://localhost:3xxxx/ <!-- ```open http://node1:3xxxx/``` --> ] The dashboard will then ask you which authentication you want to use. .debug[[k8s/dashboard.md](https://github.com/BretFisher/kubernetes-mastery/tree/mastery/slides/k8s/dashboard.md)] --- ## Dashboard authentication - We have three authentication options at this point: - token (associated with a role that has appropriate permissions) - kubeconfig (e.g. using the `~/.kube/config` file) - "skip" (use the dashboard "service account") - Let's use "skip": we're logged in! -- .warning[By the way, we just added a backdoor to our Kubernetes cluster!] .debug[[k8s/dashboard.md](https://github.com/BretFisher/kubernetes-mastery/tree/mastery/slides/k8s/dashboard.md)] --- ## Running the Kubernetes Dashboard securely - The steps that we just showed you are *for educational purposes only!* - If you do that on your production cluster, people [can and will abuse it](https://redlock.io/blog/cryptojacking-tesla) - For an in-depth discussion about securing the dashboard, <br/> check [this excellent post on Heptio's blog](https://blog.heptio.com/on-securing-the-kubernetes-dashboard-16b09b1b7aca) -- - Minikube/microK8s can be enabled with easy commands `minikube dashboard` and `microk8s enable dashboard` .debug[[k8s/dashboard.md](https://github.com/BretFisher/kubernetes-mastery/tree/mastery/slides/k8s/dashboard.md)] --- ## Other dashboards - [Kube Web View](https://codeberg.org/hjacobs/kube-web-view) - read-only dashboard - optimized for "troubleshooting and incident response" - see [vision and goals](https://kube-web-view.readthedocs.io/en/latest/vision.html#vision) for details - [Kube Ops View](https://github.com/hjacobs/kube-ops-view) - "provides a common operational picture for multiple Kubernetes clusters" -- - Your Kubernetes distro comes with one! -- - Cloud-provided control-planes often don't come with one .debug[[k8s/dashboard.md](https://github.com/BretFisher/kubernetes-mastery/tree/mastery/slides/k8s/dashboard.md)] --- class: pic .interstitial[] --- name: toc-security-implications-of-kubectl-apply class: title Security implications of `kubectl apply` .nav[ [Previous section](#toc-the-kubernetes-dashboard) | [Back to table of contents](#toc-chapter-4) | [Next section](#toc-scaling-our-demo-app) ] .debug[(automatically generated title slide)] --- # Security implications of `kubectl apply` - When we do `kubectl apply -f <URL>`, we create arbitrary resources - Resources can be evil; imagine a `deployment` that ... -- - starts bitcoin miners on the whole cluster -- - hides in a non-default namespace -- - bind-mounts our nodes' filesystem -- - inserts SSH keys in the root account (on the node) -- - encrypts our data and ransoms it -- - ☠️☠️☠️ .debug[[k8s/dashboard.md](https://github.com/BretFisher/kubernetes-mastery/tree/mastery/slides/k8s/dashboard.md)] --- ## `kubectl apply` is the new `curl | sh` - `curl | sh` is convenient - It's safe if you use HTTPS URLs from trusted sources -- - `kubectl apply -f` is convenient - It's safe if you use HTTPS URLs from trusted sources - Example: the official setup instructions for most pod networks -- - It introduces new failure modes (for instance, if you try to apply YAML from a link that's no longer valid) .debug[[k8s/dashboard.md](https://github.com/BretFisher/kubernetes-mastery/tree/mastery/slides/k8s/dashboard.md)] --- class: pic .interstitial[] --- name: toc-scaling-our-demo-app class: title Scaling our demo app .nav[ [Previous section](#toc-security-implications-of-kubectl-apply) | [Back to table of contents](#toc-chapter-4) | [Next section](#toc-daemon-sets) ] .debug[(automatically generated title slide)] --- # Scaling our demo app - Our ultimate goal is to get more DockerCoins (i.e. increase the number of loops per second shown on the web UI) - Let's look at the [architecture](images/dockercoins-diagram.svg) again:  -- - We're at 4 hashes a second. Let's ramp this up! - The loop is done in the worker; perhaps we could try adding more workers? .debug[[k8s/scalingdockercoins.md](https://github.com/BretFisher/kubernetes-mastery/tree/mastery/slides/k8s/scalingdockercoins.md)] --- ## Adding another worker - All we have to do is scale the `worker` Deployment .exercise[ - Open a new terminal to keep an eye on our pods: ```bash kubectl get pods -w ``` <!-- ```wait RESTARTS``` ```tmux split-pane -h``` --> - Now, create more `worker` replicas: ```bash kubectl scale deployment worker --replicas=2 ``` ] -- After a few seconds, the graph in the web UI should show up. .debug[[k8s/scalingdockercoins.md](https://github.com/BretFisher/kubernetes-mastery/tree/mastery/slides/k8s/scalingdockercoins.md)] --- ## Adding more workers - If 2 workers give us 2x speed, what about 3 workers? .exercise[ - Scale the `worker` Deployment further: ```bash kubectl scale deployment worker --replicas=3 ``` ] -- The graph in the web UI should go up again. (This is looking great! We're gonna be RICH!) .debug[[k8s/scalingdockercoins.md](https://github.com/BretFisher/kubernetes-mastery/tree/mastery/slides/k8s/scalingdockercoins.md)] --- ## Adding even more workers - Let's see if 10 workers give us 10x speed! .exercise[ - Scale the `worker` Deployment to a bigger number: ```bash kubectl scale deployment worker --replicas=10 ``` <!-- ```key ^D``` ```key ^C``` --> ] -- The graph will peak at 10-12 hashes/second. (We can add as many workers as we want: we will never go past 10-12 hashes/second.) .debug[[k8s/scalingdockercoins.md](https://github.com/BretFisher/kubernetes-mastery/tree/mastery/slides/k8s/scalingdockercoins.md)] --- class: extra-details ## Didn't we briefly exceed 10 hashes/second? - It may *look like it*, because the web UI shows instant speed - The instant speed can briefly exceed 10 hashes/second - The average speed cannot - The instant speed can be biased because of how it's computed .debug[[k8s/scalingdockercoins.md](https://github.com/BretFisher/kubernetes-mastery/tree/mastery/slides/k8s/scalingdockercoins.md)] --- class: extra-details, not-mastery ## Why instant speed is misleading - The instant speed is computed client-side by the web UI - The web UI checks the hash counter once per second <br/> (and does a classic (h2-h1)/(t2-t1) speed computation) - The counter is updated once per second by the workers - These timings are not exact <br/> (e.g. the web UI check interval is client-side JavaScript) - Sometimes, between two web UI counter measurements, <br/> the workers are able to update the counter *twice* - During that cycle, the instant speed will appear to be much bigger <br/> (but it will be compensated by lower instant speed before and after) .debug[[k8s/scalingdockercoins.md](https://github.com/BretFisher/kubernetes-mastery/tree/mastery/slides/k8s/scalingdockercoins.md)] --- ## Why are we stuck at 10-12 hashes per second? - If this was high-quality, production code, we would have instrumentation (Datadog, Honeycomb, New Relic, statsd, Sumologic, ...) - It's not! - Perhaps we could benchmark our web services? (with tools like `ab`, or even simpler, `httping`) .debug[[k8s/scalingdockercoins.md](https://github.com/BretFisher/kubernetes-mastery/tree/mastery/slides/k8s/scalingdockercoins.md)] --- ## Benchmarking our web services - We want to check `hasher` and `rng` - We are going to use `httping` - It's just like `ping`, but using HTTP `GET` requests (it measures how long it takes to perform one `GET` request) - It's used like this: ``` httping [-c count] http://host:port/path ``` - Or even simpler: ``` httping ip.ad.dr.ess ``` - We will use `httping` on the ClusterIP addresses of our services .debug[[k8s/scalingdockercoins.md](https://github.com/BretFisher/kubernetes-mastery/tree/mastery/slides/k8s/scalingdockercoins.md)] --- ## Obtaining ClusterIP addresses - We can simply check the output of `kubectl get services` - Or do it programmatically, as in the example below .exercise[ - Retrieve the IP addresses: ```bash HASHER=$(kubectl get svc hasher -o go-template={{.spec.clusterIP}}) RNG=$(kubectl get svc rng -o go-template={{.spec.clusterIP}}) ``` ] Now we can access the IP addresses of our services through `$HASHER` and `$RNG`. .debug[[k8s/scalingdockercoins.md](https://github.com/BretFisher/kubernetes-mastery/tree/mastery/slides/k8s/scalingdockercoins.md)] --- ## Checking `hasher` and `rng` response times .exercise[ - Remember to use [`shpod`](#shpod) on macOS and Windows: ```bash kubectl attach --namespace=shpod -ti shpod ``` - Check the response times for both services: ```bash httping -c 3 $HASHER httping -c 3 $RNG ``` ] -- - `hasher` is fine (it should take a few milliseconds to reply) - `rng` is not (it should take about 700 milliseconds if there are 10 workers) - Something is wrong with `rng`, but ... what? .debug[[k8s/scalingdockercoins.md](https://github.com/BretFisher/kubernetes-mastery/tree/mastery/slides/k8s/scalingdockercoins.md)] --- ## Let's draw hasty conclusions - The bottleneck seems to be `rng` - *What if* we don't have enough entropy and can't generate enough random numbers? - We need to scale out the `rng` service on multiple machines! Note: this is a fiction! We have enough entropy. But we need a pretext to scale out. .footnote[ (In fact, the code of `rng` uses `/dev/urandom`, which never runs out of entropy... <br/> ...and is [just as good as `/dev/random`](http://www.slideshare.net/PacSecJP/filippo-plain-simple-reality-of-entropy).) ] -- - **Oops** we only have one node for learning. 🤔 -- - Let's pretend and I'll explain along the way .debug[[shared/hastyconclusions.md](https://github.com/BretFisher/kubernetes-mastery/tree/mastery/slides/shared/hastyconclusions.md)] --- class: pic .interstitial[] --- name: toc-daemon-sets class: title Daemon sets .nav[ [Previous section](#toc-scaling-our-demo-app) | [Back to table of contents](#toc-chapter-4) | [Next section](#toc-labels-and-selectors) ] .debug[(automatically generated title slide)] --- # Daemon sets - We want to scale `rng` in a way that is different from how we scaled `worker` - We want one (and exactly one) instance of `rng` per node - We *do not want* two instances of `rng` on the same node - We will do that with a *daemon set* .debug[[k8s/daemonset.md](https://github.com/BretFisher/kubernetes-mastery/tree/mastery/slides/k8s/daemonset.md)] --- ## Why not a deployment? - Can't we just do `kubectl scale deployment rng --replicas=...`? -- - Nothing guarantees that the `rng` containers will be distributed evenly -- - If we add nodes later, they will not automatically run a copy of `rng` -- - If we remove (or reboot) a node, one `rng` container will restart elsewhere (and we will end up with two instances `rng` on the same node) -- - By contrast, a daemon set will start one pod per node and keep it that way (as nodes are added or removed) .debug[[k8s/daemonset.md](https://github.com/BretFisher/kubernetes-mastery/tree/mastery/slides/k8s/daemonset.md)] --- ## Daemon sets in practice - Daemon sets are great for cluster-wide, per-node processes: - `kube-proxy` - CNI network plugins - monitoring agents - hardware management tools (e.g. SCSI/FC HBA agents) - etc. - They can also be restricted to run [only on some nodes](https://kubernetes.io/docs/concepts/workloads/controllers/daemonset/#running-pods-on-only-some-nodes) .debug[[k8s/daemonset.md](https://github.com/BretFisher/kubernetes-mastery/tree/mastery/slides/k8s/daemonset.md)] --- ## Creating a daemon set <!-- ##VERSION## --> - Unfortunately, as of Kubernetes 1.17, the CLI cannot create daemon sets -- - More precisely: it doesn't have a subcommand to create a daemon set -- - But any kind of resource can always be created by providing a YAML description: ```bash kubectl apply -f foo.yaml ``` -- - How do we create the YAML file for our daemon set? -- - option 1: [read the docs](https://kubernetes.io/docs/concepts/workloads/controllers/daemonset/#create-a-daemonset) -- - option 2: `vi` our way out of it .debug[[k8s/daemonset.md](https://github.com/BretFisher/kubernetes-mastery/tree/mastery/slides/k8s/daemonset.md)] --- ## Creating the YAML file for our daemon set - Let's start with the YAML file for the current `rng` resource .exercise[ - Dump the `rng` resource in YAML: ```bash kubectl get deploy/rng -o yaml >rng.yml ``` - Edit `rng.yml` ] .debug[[k8s/daemonset.md](https://github.com/BretFisher/kubernetes-mastery/tree/mastery/slides/k8s/daemonset.md)] --- ## "Casting" a resource to another - What if we just changed the `kind` field? (It can't be that easy, right?) .exercise[ - Change `kind: Deployment` to `kind: DaemonSet` <!-- ```bash vim rng.yml``` ```wait kind: Deployment``` ```keys /Deployment``` ```key ^J``` ```keys cwDaemonSet``` ```key ^[``` ] ```keys :wq``` ```key ^J``` --> - Save, quit - Try to create our new resource: ```bash kubectl apply -f rng.yml ``` <!-- ```wait error:``` --> ] -- We all knew this couldn't be that easy, right! .debug[[k8s/daemonset.md](https://github.com/BretFisher/kubernetes-mastery/tree/mastery/slides/k8s/daemonset.md)] --- ## Understanding the problem - The core of the error is: ``` error validating data: [ValidationError(DaemonSet.spec): unknown field "replicas" in io.k8s.api.extensions.v1beta1.DaemonSetSpec, ... ``` -- - *Obviously,* it doesn't make sense to specify a number of replicas for a daemon set -- - Workaround: fix the YAML - remove the `replicas` field - remove the `strategy` field (which defines the rollout mechanism for a deployment) - remove the `progressDeadlineSeconds` field (also used by the rollout mechanism) - remove the `status: {}` line at the end -- - Or, we could also ... .debug[[k8s/daemonset.md](https://github.com/BretFisher/kubernetes-mastery/tree/mastery/slides/k8s/daemonset.md)] --- ## Use the `--force`, Luke - We could also tell Kubernetes to ignore these errors and try anyway - The `--force` flag's actual name is `--validate=false` .exercise[ - Try to load our YAML file and ignore errors: ```bash kubectl apply -f rng.yml --validate=false ``` ] -- 🎩✨🐇 -- Wait ... Now, can it be *that* easy? .debug[[k8s/daemonset.md](https://github.com/BretFisher/kubernetes-mastery/tree/mastery/slides/k8s/daemonset.md)] --- ## Checking what we've done - Did we transform our `deployment` into a `daemonset`? .exercise[ - Look at the resources that we have now: ```bash kubectl get all ``` ] -- We have two resources called `rng`: - the *deployment* that was existing before - the *daemon set* that we just created We also have one too many pods. <br/> (The pod corresponding to the *deployment* still exists.) .debug[[k8s/daemonset.md](https://github.com/BretFisher/kubernetes-mastery/tree/mastery/slides/k8s/daemonset.md)] --- ## `deploy/rng` and `ds/rng` - You can have different resource types with the same name (i.e. a *deployment* and a *daemon set* both named `rng`) - We still have the old `rng` *deployment* ``` NAME DESIRED CURRENT UP-TO-DATE AVAILABLE AGE deployment.apps/rng 1 1 1 1 18m ``` - But now we have the new `rng` *daemon set* as well ``` NAME DESIRED CURRENT READY UP-TO-DATE AVAILABLE NODE SELECTOR AGE daemonset.apps/rng 2 2 2 2 2 <none> 9s ``` .debug[[k8s/daemonset.md](https://github.com/BretFisher/kubernetes-mastery/tree/mastery/slides/k8s/daemonset.md)] --- ## Too many pods - If we check with `kubectl get pods`, we see: - *one pod* for the deployment (named `rng-xxxxxxxxxx-yyyyy`) - *one pod per node* for the daemon set (named `rng-zzzzz`) ``` NAME READY STATUS RESTARTS AGE rng-54f57d4d49-7pt82 1/1 Running 0 11m rng-b85tm 1/1 Running 0 25s rng-hfbrr 1/1 Running 0 25s [...] ``` -- The daemon set created one pod per node. In a multi-node setup, masters usually have [taints](https://kubernetes.io/docs/concepts/configuration/taint-and-toleration/) preventing pods from running there. (To schedule a pod on this node anyway, the pod will require appropriate [tolerations](https://kubernetes.io/docs/concepts/configuration/taint-and-toleration/).) .debug[[k8s/daemonset.md](https://github.com/BretFisher/kubernetes-mastery/tree/mastery/slides/k8s/daemonset.md)] --- ## Is this working? - Look at the web UI -- - The graph should now go above 10 hashes per second! -- - It looks like the newly created pods are serving traffic correctly - How and why did this happen? (We didn't do anything special to add them to the `rng` service load balancer!) .debug[[k8s/daemonset.md](https://github.com/BretFisher/kubernetes-mastery/tree/mastery/slides/k8s/daemonset.md)] --- class: pic .interstitial[] --- name: toc-labels-and-selectors class: title Labels and selectors .nav[ [Previous section](#toc-daemon-sets) | [Back to table of contents](#toc-chapter-4) | [Next section](#toc-authoring-yaml) ] .debug[(automatically generated title slide)] --- # Labels and selectors - The `rng` *service* is load balancing requests to a set of pods - That set of pods is defined by the *selector* of the `rng` service .exercise[ - Check the *selector* in the `rng` service definition: ```bash kubectl describe service rng ``` ] - The selector is `app=rng` - It means "all the pods having the label `app=rng`" (They can have additional labels as well, that's OK!) .debug[[k8s/daemonset.md](https://github.com/BretFisher/kubernetes-mastery/tree/mastery/slides/k8s/daemonset.md)] --- ## Selector evaluation - We can use selectors with many `kubectl` commands - For instance, with `kubectl get`, `kubectl logs`, `kubectl delete` ... and more .exercise[ - Get the list of pods matching selector `app=rng`: ```bash kubectl get pods -l app=rng kubectl get pods --selector app=rng ``` ] But ... why do these pods (in particular, the *new* ones) have this `app=rng` label? .debug[[k8s/daemonset.md](https://github.com/BretFisher/kubernetes-mastery/tree/mastery/slides/k8s/daemonset.md)] --- ## Where do labels come from? - When we create a deployment with `kubectl create deployment rng`, <br/>this deployment gets the label `app=rng` - The replica sets created by this deployment also get the label `app=rng` - The pods created by these replica sets also get the label `app=rng` - When we created the daemon set from the deployment, we re-used the same spec - Therefore, the pods created by the daemon set get the same labels - When we use `kubectl run stuff`, the label is `run=stuff` instead .debug[[k8s/daemonset.md](https://github.com/BretFisher/kubernetes-mastery/tree/mastery/slides/k8s/daemonset.md)] --- ## Updating load balancer configuration - We would like to remove a pod from the load balancer - What would happen if we removed that pod, with `kubectl delete pod ...`? -- It would be re-created immediately (by the replica set or the daemon set) -- - What would happen if we removed the `app=rng` label from that pod? -- It would *also* be re-created immediately -- Why?!? .debug[[k8s/daemonset.md](https://github.com/BretFisher/kubernetes-mastery/tree/mastery/slides/k8s/daemonset.md)] --- ## Selectors for replica sets and daemon sets - The "mission" of a replica set is: "Make sure that there is the right number of pods matching this spec!" - The "mission" of a daemon set is: "Make sure that there is a pod matching this spec on each node!" -- - *In fact,* replica sets and daemon sets do not check pod specifications - They merely have a *selector*, and they look for pods matching that selector - Yes, we can fool them by manually creating pods with the "right" labels - Bottom line: if we remove our `app=rng` label ... ... The pod "disappears" for its parent, which re-creates another pod to replace it .debug[[k8s/daemonset.md](https://github.com/BretFisher/kubernetes-mastery/tree/mastery/slides/k8s/daemonset.md)] --- class: extra-details ## Isolation of replica sets and daemon sets - Since both the `rng` daemon set and the `rng` replica set use `app=rng` ... ... Why don't they "find" each other's pods? -- - *Replica sets* have a more specific selector, visible with `kubectl describe` (It looks like `app=rng,pod-template-hash=abcd1234`) - *Daemon sets* also have a more specific selector, but it's invisible (It looks like `app=rng,controller-revision-hash=abcd1234`) - As a result, each controller only "sees" the pods it manages .debug[[k8s/daemonset.md](https://github.com/BretFisher/kubernetes-mastery/tree/mastery/slides/k8s/daemonset.md)] --- ## Removing a pod from the load balancer - Currently, the `rng` service is defined by the `app=rng` selector - The only way to remove a pod is to remove or change the `app` label - ... But that will cause another pod to be created instead! - What's the solution? -- - We need to change the selector of the `rng` service! - Let's add another label to that selector (e.g. `active=yes`) .debug[[k8s/daemonset.md](https://github.com/BretFisher/kubernetes-mastery/tree/mastery/slides/k8s/daemonset.md)] --- ## Complex selectors - If a selector specifies multiple labels, they are understood as a logical *AND* (In other words: the pods must match all the labels) - Kubernetes has support for advanced, set-based selectors (But these cannot be used with services, at least not yet!) .debug[[k8s/daemonset.md](https://github.com/BretFisher/kubernetes-mastery/tree/mastery/slides/k8s/daemonset.md)] --- ## The plan 1. Add the label `active=yes` to all our `rng` pods 2. Update the selector for the `rng` service to also include `active=yes` 3. Toggle traffic to a pod by manually adding/removing the `active` label 4. Profit! *Note: if we swap steps 1 and 2, it will cause a short service disruption, because there will be a period of time during which the service selector won't match any pod. During that time, requests to the service will time out. By doing things in the order above, we guarantee that there won't be any interruption.* .debug[[k8s/daemonset.md](https://github.com/BretFisher/kubernetes-mastery/tree/mastery/slides/k8s/daemonset.md)] --- ## Adding labels to pods - We want to add the label `active=yes` to all pods that have `app=rng` - We could edit each pod one by one with `kubectl edit` ... - ... Or we could use `kubectl label` to label them all - `kubectl label` can use selectors itself .exercise[ - Add `active=yes` to all pods that have `app=rng`: ```bash kubectl label pods -l app=rng active=yes ``` ] .debug[[k8s/daemonset.md](https://github.com/BretFisher/kubernetes-mastery/tree/mastery/slides/k8s/daemonset.md)] --- ## Updating the service selector - We need to edit the service specification - Reminder: in the service definition, we will see `app: rng` in two places - the label of the service itself (we don't need to touch that one) - the selector of the service (that's the one we want to change) .exercise[ - Update the service to add `active: yes` to its selector: ```bash kubectl edit service rng ``` <!-- ```wait Please edit the object below``` ```keys /app: rng``` ```key ^J``` ```keys noactive: yes``` ```key ^[``` ] ```keys :wq``` ```key ^J``` --> ] -- ... And then we get *the weirdest error ever.* Why? .debug[[k8s/daemonset.md](https://github.com/BretFisher/kubernetes-mastery/tree/mastery/slides/k8s/daemonset.md)] --- ## When the YAML parser is being too smart - YAML parsers try to help us: - `xyz` is the string `"xyz"` - `42` is the integer `42` - `yes` is the boolean value `true` - If we want the string `"42"` or the string `"yes"`, we have to quote them - So we have to use `active: "yes"` .footnote[For a good laugh: if we had used "ja", "oui", "si" ... as the value, it would have worked!] .debug[[k8s/daemonset.md](https://github.com/BretFisher/kubernetes-mastery/tree/mastery/slides/k8s/daemonset.md)] --- ## Updating the service selector, take 2 .exercise[ - Update the YAML manifest of the service - Add `active: "yes"` to its selector <!-- ```wait Please edit the object below``` ```keys /yes``` ```key ^J``` ```keys cw"yes"``` ```key ^[``` ] ```keys :wq``` ```key ^J``` --> ] This time it should work! If we did everything correctly, the web UI shouldn't show any change. .debug[[k8s/daemonset.md](https://github.com/BretFisher/kubernetes-mastery/tree/mastery/slides/k8s/daemonset.md)] --- ## Updating labels - We want to disable the pod that was created by the deployment - All we have to do, is remove the `active` label from that pod - To identify that pod, we can use its name - ... Or rely on the fact that it's the only one with a `pod-template-hash` label - Good to know: - `kubectl label ... foo=` doesn't remove a label (it sets it to an empty string) - to remove label `foo`, use `kubectl label ... foo-` - to change an existing label, we would need to add `--overwrite` .debug[[k8s/daemonset.md](https://github.com/BretFisher/kubernetes-mastery/tree/mastery/slides/k8s/daemonset.md)] --- ## Removing a pod from the load balancer .exercise[ - In one window, check the logs of that pod: ```bash POD=$(kubectl get pod -l app=rng,pod-template-hash -o name) kubectl logs --tail 1 --follow $POD ``` (We should see a steady stream of HTTP logs) <!-- ```wait HTTP/1.1``` ```tmux split-pane -v``` --> - In another window, remove the label from the pod: ```bash kubectl label pod -l app=rng,pod-template-hash active- ``` (The stream of HTTP logs should stop immediately) <!-- ```key ^D``` ```key ^C``` --> ] There might be a slight change in the web UI (since we removed a bit of capacity from the `rng` service). If we remove more pods, the effect should be more visible. .debug[[k8s/daemonset.md](https://github.com/BretFisher/kubernetes-mastery/tree/mastery/slides/k8s/daemonset.md)] --- class: extra-details ## Updating the daemon set - If we scale up our cluster by adding new nodes, the daemon set will create more pods - These pods won't have the `active=yes` label - If we want these pods to have that label, we need to edit the daemon set spec - We can do that with e.g. `kubectl edit daemonset rng` .debug[[k8s/daemonset.md](https://github.com/BretFisher/kubernetes-mastery/tree/mastery/slides/k8s/daemonset.md)] --- class: extra-details ## We've put resources in your resources - Reminder: a daemon set is a resource that creates more resources! - There is a difference between: - the label(s) of a resource (in the `metadata` block in the beginning) - the selector of a resource (in the `spec` block) - the label(s) of the resource(s) created by the first resource (in the `template` block) - We would need to update the selector and the template (metadata labels are not mandatory) - The template must match the selector (i.e. the resource will refuse to create resources that it will not select) .debug[[k8s/daemonset.md](https://github.com/BretFisher/kubernetes-mastery/tree/mastery/slides/k8s/daemonset.md)] --- ## Labels and debugging - When a pod is misbehaving, we can delete it: another one will be recreated - But we can also change its labels - It will be removed from the load balancer (it won't receive traffic anymore) - Another pod will be recreated immediately - But the problematic pod is still here, and we can inspect and debug it - We can even re-add it to the rotation if necessary (Very useful to troubleshoot intermittent and elusive bugs) .debug[[k8s/daemonset.md](https://github.com/BretFisher/kubernetes-mastery/tree/mastery/slides/k8s/daemonset.md)] --- ## Labels and advanced rollout control - Conversely, we can add pods matching a service's selector - These pods will then receive requests and serve traffic - Examples: - one-shot pod with all debug flags enabled, to collect logs - pods created automatically, but added to rotation in a second step <br/> (by setting their label accordingly) - This gives us building blocks for canary and blue/green deployments .debug[[k8s/daemonset.md](https://github.com/BretFisher/kubernetes-mastery/tree/mastery/slides/k8s/daemonset.md)] --- class: pic .interstitial[] --- name: toc-authoring-yaml class: title Authoring YAML .nav[ [Previous section](#toc-labels-and-selectors) | [Back to table of contents](#toc-chapter-4) | [Next section](#toc-rolling-updates) ] .debug[(automatically generated title slide)] --- # Authoring YAML - There are various ways to generate YAML with Kubernetes, e.g.: - `kubectl run` - `kubectl create deployment` (and a few other `kubectl create` variants) - `kubectl expose` - When and why do we need to write our own YAML? - How do we write YAML from scratch? .debug[[k8s/dryrun.md](https://github.com/BretFisher/kubernetes-mastery/tree/mastery/slides/k8s/dryrun.md)] --- ## The limits of generated YAML - Many advanced (and even not-so-advanced) features require to write YAML: - pods with multiple containers - resource limits - healthchecks - DaemonSets, StatefulSets - and more! - How do we access these features? .debug[[k8s/dryrun.md](https://github.com/BretFisher/kubernetes-mastery/tree/mastery/slides/k8s/dryrun.md)] --- ## We don't have to start from scratch - Create a resource (e.g. Deployment) - Dump its YAML with `kubectl get -o yaml ...` - Edit the YAML - Use `kubectl apply -f ...` with the YAML file to: - update the resource (if it's the same kind) - create a new resource (if it's a different kind) - Or: Use The Docs, Luke (the documentation almost always has YAML examples) .debug[[k8s/dryrun.md](https://github.com/BretFisher/kubernetes-mastery/tree/mastery/slides/k8s/dryrun.md)] --- ## Generating YAML without creating resources - We can use the `--dry-run` option .exercise[ - Generate the YAML for a Deployment without creating it: ```bash kubectl create deployment web --image nginx --dry-run ``` ] - We can clean up that YAML even more if we want (for instance, we can remove the `creationTimestamp` and empty dicts) .debug[[k8s/dryrun.md](https://github.com/BretFisher/kubernetes-mastery/tree/mastery/slides/k8s/dryrun.md)] --- ## Using `--dry-run` with `kubectl apply` - The `--dry-run` option can also be used with `kubectl apply` - However, it can be misleading (it doesn't do a "real" dry run) - Let's see what happens in the following scenario: - generate the YAML for a Deployment - tweak the YAML to transform it into a DaemonSet - apply that YAML to see what would actually be created .debug[[k8s/dryrun.md](https://github.com/BretFisher/kubernetes-mastery/tree/mastery/slides/k8s/dryrun.md)] --- ## The limits of `kubectl apply --dry-run` .exercise[ - Generate the YAML for a deployment: ```bash kubectl create deployment web --image=nginx -o yaml > web.yaml ``` - Change the `kind` in the YAML to make it a `DaemonSet`: ```bash sed -i s/Deployment/DaemonSet/ web.yaml ``` - Ask `kubectl` what would be applied: ```bash kubectl apply -f web.yaml --dry-run --validate=false -o yaml ``` ] The resulting YAML doesn't represent a valid DaemonSet. .debug[[k8s/dryrun.md](https://github.com/BretFisher/kubernetes-mastery/tree/mastery/slides/k8s/dryrun.md)] --- ## Server-side dry run - Since Kubernetes 1.13, we can use [server-side dry run and diffs](https://kubernetes.io/blog/2019/01/14/apiserver-dry-run-and-kubectl-diff/) - Server-side dry run will do all the work, but *not* persist to etcd (all validation and mutation hooks will be executed) .exercise[ - Try the same YAML file as earlier, with server-side dry run: ```bash kubectl apply -f web.yaml --server-dry-run --validate=false -o yaml ``` ] The resulting YAML doesn't have the `replicas` field anymore. Instead, it has the fields expected in a DaemonSet. .debug[[k8s/dryrun.md](https://github.com/BretFisher/kubernetes-mastery/tree/mastery/slides/k8s/dryrun.md)] --- ## Advantages of server-side dry run - The YAML is verified much more extensively - The only step that is skipped is "write to etcd" - YAML that passes server-side dry run *should* apply successfully (unless the cluster state changes by the time the YAML is actually applied) - Validating or mutating hooks that have side effects can also be an issue .debug[[k8s/dryrun.md](https://github.com/BretFisher/kubernetes-mastery/tree/mastery/slides/k8s/dryrun.md)] --- ## `kubectl diff` - Kubernetes 1.13 also introduced `kubectl diff` - `kubectl diff` does a server-side dry run, *and* shows differences .exercise[ - Try `kubectl diff` on the YAML that we tweaked earlier: ```bash kubectl diff -f web.yaml ``` <!-- ```wait status:``` --> ] Note: we don't need to specify `--validate=false` here. .debug[[k8s/dryrun.md](https://github.com/BretFisher/kubernetes-mastery/tree/mastery/slides/k8s/dryrun.md)] --- ## Advantage of YAML - Using YAML (instead of `kubectl run`/`create`/etc.) allows to be *declarative* - The YAML describes the desired state of our cluster and applications - YAML can be stored, versioned, archived (e.g. in git repositories) - To change resources, change the YAML files (instead of using `kubectl edit`/`scale`/`label`/etc.) - Changes can be reviewed before being applied (with code reviews, pull requests ...) - This workflow is sometimes called "GitOps" (there are tools like Weave Flux or GitKube to facilitate it) .debug[[k8s/dryrun.md](https://github.com/BretFisher/kubernetes-mastery/tree/mastery/slides/k8s/dryrun.md)] --- ## YAML in practice - Get started with `kubectl run`/`create`/`expose`/etc. - Dump the YAML with `kubectl get -o yaml` - Tweak that YAML and `kubectl apply` it back - Store that YAML for reference (for further deployments) - Feel free to clean up the YAML: - remove fields you don't know - check that it still works! - That YAML will be useful later when using e.g. Kustomize or Helm .debug[[k8s/dryrun.md](https://github.com/BretFisher/kubernetes-mastery/tree/mastery/slides/k8s/dryrun.md)] --- class: pic .interstitial[] --- name: toc-rolling-updates class: title Rolling updates .nav[ [Previous section](#toc-authoring-yaml) | [Back to table of contents](#toc-chapter-5) | [Next section](#toc-healthchecks) ] .debug[(automatically generated title slide)] --- # Rolling updates - By default (without rolling updates), when a scaled resource is updated: - new pods are created - old pods are terminated - ... all at the same time - if something goes wrong, ¯\\\_(ツ)\_/¯ .debug[[k8s/rollout.md](https://github.com/BretFisher/kubernetes-mastery/tree/mastery/slides/k8s/rollout.md)] --- ## Rolling updates - With rolling updates, when a Deployment is updated, it happens progressively - The Deployment controls multiple ReplicaSets -- - Each ReplicaSet is a group of identical Pods (with the same image, arguments, parameters ...) -- - During the rolling update, we have at least two ReplicaSets: - the "new" set (corresponding to the "target" version) - at least one "old" set -- - We can have multiple "old" sets (if we start another update before the first one is done) .debug[[k8s/rollout.md](https://github.com/BretFisher/kubernetes-mastery/tree/mastery/slides/k8s/rollout.md)] --- ## Update strategy - Two parameters determine the pace of the rollout: `maxUnavailable` and `maxSurge` -- - They can be specified in absolute number of pods, or percentage of the `replicas` count -- - At any given time ... - there will always be at least `replicas`-`maxUnavailable` pods available - there will never be more than `replicas`+`maxSurge` pods in total - there will therefore be up to `maxUnavailable`+`maxSurge` pods being updated -- - We have the possibility of rolling back to the previous version <br/>(if the update fails or is unsatisfactory in any way) .debug[[k8s/rollout.md](https://github.com/BretFisher/kubernetes-mastery/tree/mastery/slides/k8s/rollout.md)] --- ## Checking current rollout parameters - Recall how we build custom reports with `kubectl` and `jq`: .exercise[ - Show the rollout plan for our deployments: ```bash kubectl get deploy -o json | jq ".items[] | {name:.metadata.name} + .spec.strategy.rollingUpdate" ``` ] .debug[[k8s/rollout.md](https://github.com/BretFisher/kubernetes-mastery/tree/mastery/slides/k8s/rollout.md)] --- ## Rolling updates in practice - As of Kubernetes 1.8, we can do rolling updates with: `deployments`, `daemonsets`, `statefulsets` - Editing one of these resources will automatically result in a rolling update - Rolling updates can be monitored with the `kubectl rollout` subcommand .debug[[k8s/rollout.md](https://github.com/BretFisher/kubernetes-mastery/tree/mastery/slides/k8s/rollout.md)] --- ## Rolling out the new `worker` service .exercise[ - Let's monitor what's going on by opening a few terminals, and run: ```bash kubectl get pods -w kubectl get replicasets -w kubectl get deployments -w ``` <!-- ```wait NAME``` ```key ^C``` --> - Update `worker` either with `kubectl edit`, or by running: ```bash kubectl set image deploy worker worker=dockercoins/worker:v0.2 ``` ] -- That rollout should be pretty quick. What shows in the web UI? .debug[[k8s/rollout.md](https://github.com/BretFisher/kubernetes-mastery/tree/mastery/slides/k8s/rollout.md)] --- ## Give it some time - At first, it looks like nothing is happening (the graph remains at the same level) - According to `kubectl get deploy -w`, the `deployment` was updated really quickly - But `kubectl get pods -w` tells a different story - The old `pods` are still here, and they stay in `Terminating` state for a while - Eventually, they are terminated; and then the graph decreases significantly - This delay is due to the fact that our worker doesn't handle signals - Kubernetes sends a "polite" shutdown request to the worker, which ignores it - After a grace period, Kubernetes gets impatient and kills the container (The grace period is 30 seconds, but [can be changed](https://kubernetes.io/docs/concepts/workloads/pods/pod/#termination-of-pods) if needed) .debug[[k8s/rollout.md](https://github.com/BretFisher/kubernetes-mastery/tree/mastery/slides/k8s/rollout.md)] --- ## Rolling out something invalid - What happens if we make a mistake? .exercise[ - Update `worker` by specifying a non-existent image: ```bash kubectl set image deploy worker worker=dockercoins/worker:v0.3 ``` - Check what's going on: ```bash kubectl rollout status deploy worker ``` <!-- ```wait Waiting for deployment``` ```key ^C``` --> ] -- Our rollout is stuck. However, the app is not dead. (After a minute, it will stabilize to be 20-25% slower.) .debug[[k8s/rollout.md](https://github.com/BretFisher/kubernetes-mastery/tree/mastery/slides/k8s/rollout.md)] --- ## What's going on with our rollout? - Why is our app a bit slower? - Because `MaxUnavailable=25%` ... So the rollout terminated 2 replicas out of 10 available - Okay, but why do we see 5 new replicas being rolled out? - Because `MaxSurge=25%` ... So in addition to replacing 2 replicas, the rollout is also starting 3 more - It rounded down the number of MaxUnavailable pods conservatively, <br/> but the total number of pods being rolled out is allowed to be 25+25=50% .debug[[k8s/rollout.md](https://github.com/BretFisher/kubernetes-mastery/tree/mastery/slides/k8s/rollout.md)] --- class: extra-details ## The nitty-gritty details - We start with 10 pods running for the `worker` deployment - Current settings: MaxUnavailable=25% and MaxSurge=25% - When we start the rollout: - two replicas are taken down (as per MaxUnavailable=25%) - two others are created (with the new version) to replace them - three others are created (with the new version) per MaxSurge=25%) - Now we have 8 replicas up and running, and 5 being deployed - Our rollout is stuck at this point! .debug[[k8s/rollout.md](https://github.com/BretFisher/kubernetes-mastery/tree/mastery/slides/k8s/rollout.md)] --- ## Checking the dashboard during the bad rollout If you didn't deploy the Kubernetes dashboard earlier, just skip this slide. .exercise[ - Connect to the dashboard that we deployed earlier - Check that we have failures in Deployments, Pods, and Replica Sets - Can we see the reason for the failure? ] .debug[[k8s/rollout.md](https://github.com/BretFisher/kubernetes-mastery/tree/mastery/slides/k8s/rollout.md)] --- ## Recovering from a bad rollout - We could push some `v0.3` image (the pod retry logic will eventually catch it and the rollout will proceed) - Or we could invoke a manual rollback .exercise[ <!-- ```key ^C``` --> - Cancel the deployment and wait for the dust to settle: ```bash kubectl rollout undo deploy worker kubectl rollout status deploy worker ``` ] .debug[[k8s/rollout.md](https://github.com/BretFisher/kubernetes-mastery/tree/mastery/slides/k8s/rollout.md)] --- ## Rolling back to an older version - We reverted to `v0.2` - But this version still has a performance problem - How can we get back to the previous version? .debug[[k8s/rollout.md](https://github.com/BretFisher/kubernetes-mastery/tree/mastery/slides/k8s/rollout.md)] --- ## Multiple "undos" - What happens if we try `kubectl rollout undo` again? .exercise[ - Try it: ```bash kubectl rollout undo deployment worker ``` - Check the web UI, the list of pods ... ] 🤔 That didn't work. .debug[[k8s/rollout.md](https://github.com/BretFisher/kubernetes-mastery/tree/mastery/slides/k8s/rollout.md)] --- ## Multiple "undos" don't work - If we see successive versions as a stack: - `kubectl rollout undo` doesn't "pop" the last element from the stack - it copies the N-1th element to the top - Multiple "undos" just swap back and forth between the last two versions! .exercise[ - Go back to v0.2 again: ```bash kubectl rollout undo deployment worker ``` ] .debug[[k8s/rollout.md](https://github.com/BretFisher/kubernetes-mastery/tree/mastery/slides/k8s/rollout.md)] --- ## In this specific scenario - Our version numbers are easy to guess - What if we had used git hashes? - What if we had changed other parameters in the Pod spec? .debug[[k8s/rollout.md](https://github.com/BretFisher/kubernetes-mastery/tree/mastery/slides/k8s/rollout.md)] --- ## Listing versions - We can list successive versions of a Deployment with `kubectl rollout history` .exercise[ - Look at our successive versions: ```bash kubectl rollout history deployment worker ``` ] We don't see *all* revisions. We might see something like 1, 4, 5. (Depending on how many "undos" we did before.) .debug[[k8s/rollout.md](https://github.com/BretFisher/kubernetes-mastery/tree/mastery/slides/k8s/rollout.md)] --- ## Explaining deployment revisions - These revisions correspond to our ReplicaSets - This information is stored in the ReplicaSet annotations .exercise[ - Check the annotations for our replica sets: ```bash kubectl describe replicasets -l app=worker | grep -A3 ^Annotations ``` ] .debug[[k8s/rollout.md](https://github.com/BretFisher/kubernetes-mastery/tree/mastery/slides/k8s/rollout.md)] --- class: extra-details ## What about the missing revisions? - The missing revisions are stored in another annotation: `deployment.kubernetes.io/revision-history` - These are not shown in `kubectl rollout history` - We could easily reconstruct the full list with a script (if we wanted to!) .debug[[k8s/rollout.md](https://github.com/BretFisher/kubernetes-mastery/tree/mastery/slides/k8s/rollout.md)] --- ## Rolling back to an older version - `kubectl rollout undo` can work with a revision number .exercise[ - Roll back to the "known good" deployment version: ```bash kubectl rollout undo deployment worker --to-revision=1 ``` - Check the web UI or the list of pods ] .debug[[k8s/rollout.md](https://github.com/BretFisher/kubernetes-mastery/tree/mastery/slides/k8s/rollout.md)] --- class: extra-details ## Changing rollout parameters - What if we wanted to, all at once: - change image to `v0.1` - be conservative on availability (always have desired number of available workers) - go slow on rollout speed (update only one pod at a time) - give some time to our workers to "warm up" before starting more The corresponding changes can be expressed in the following YAML snippet: .small[ ```yaml spec: template: spec: containers: - name: worker image: dockercoins/worker:v0.1 strategy: rollingUpdate: maxUnavailable: 0 maxSurge: 1 minReadySeconds: 10 ``` ] .debug[[k8s/rollout.md](https://github.com/BretFisher/kubernetes-mastery/tree/mastery/slides/k8s/rollout.md)] --- class: extra-details ## Applying changes through a YAML patch - We could use `kubectl edit deployment worker` - But we could also use `kubectl patch` with the exact YAML shown before .small[ - Apply all our changes and wait for them to take effect: ```bash kubectl patch deployment worker -p " spec: template: spec: containers: - name: worker image: dockercoins/worker:v0.1 strategy: rollingUpdate: maxUnavailable: 0 maxSurge: 1 minReadySeconds: 10 " kubectl rollout status deployment worker kubectl get deploy -o json worker | jq "{name:.metadata.name} + .spec.strategy.rollingUpdate" ``` ] .debug[[k8s/rollout.md](https://github.com/BretFisher/kubernetes-mastery/tree/mastery/slides/k8s/rollout.md)] --- class: pic .interstitial[] --- name: toc-healthchecks class: title Healthchecks .nav[ [Previous section](#toc-rolling-updates) | [Back to table of contents](#toc-chapter-5) | [Next section](#toc-recording-deployment-actions) ] .debug[(automatically generated title slide)] --- # Healthchecks - Healthchecks are key to providing built-in *lifecycle automation* -- - Healthchecks are *probes* that apply to *containers* (not to pods) - Kubernetes will *take action* on containers that fail healthchecks -- - Each container can have three (optional) probes: - liveness = is this container dead or alive? (most important probe) - readiness = is this container ready to serve traffic? (only needed if a service) - startup = is this container still starting up? (alpha in 1.16) -- - Different probe *handlers* are available (HTTP, TCP, program execution) -- - They don't replace a full monitoring solution - Let's see the difference and how to use them! .debug[[k8s/healthchecks.md](https://github.com/BretFisher/kubernetes-mastery/tree/mastery/slides/k8s/healthchecks.md)] --- ## Liveness probe - Indicates if the container is dead or alive - A dead container cannot come back to life - If the liveness probe fails, the container is killed (to make really sure that it's really dead; no zombies or undeads!) - What happens next depends on the pod's `restartPolicy`: - `Never`: the container is not restarted - `OnFailure` or `Always`: the container is restarted .debug[[k8s/healthchecks.md](https://github.com/BretFisher/kubernetes-mastery/tree/mastery/slides/k8s/healthchecks.md)] --- ## When to use a liveness probe - To indicate failures that can't be recovered - deadlocks (causing all requests to time out) - internal corruption (causing all requests to error) - Anything where our incident response would be "just restart/reboot it" .warning[**Do not** use liveness probes for problems that can't be fixed by a restart] - Otherwise we just restart our pods for no reason, creating useless load .debug[[k8s/healthchecks.md](https://github.com/BretFisher/kubernetes-mastery/tree/mastery/slides/k8s/healthchecks.md)] --- ## Readiness probe - Indicates if the container is ready to serve traffic - If a container becomes "unready" it might be ready again soon - If the readiness probe fails: - the container is *not* killed - if the pod is a member of a service, it is temporarily removed - it is re-added as soon as the readiness probe passes again .debug[[k8s/healthchecks.md](https://github.com/BretFisher/kubernetes-mastery/tree/mastery/slides/k8s/healthchecks.md)] --- ## When to use a readiness probe - To indicate failure due to an external cause - database is down or unreachable - mandatory auth or other backend service unavailable - To indicate temporary failure or unavailability - application can only service *N* parallel connections - runtime is busy doing garbage collection or initial data load .debug[[k8s/healthchecks.md](https://github.com/BretFisher/kubernetes-mastery/tree/mastery/slides/k8s/healthchecks.md)] --- class: extra-details ## Startup probe - Kubernetes 1.16 introduces a third type of probe: `startupProbe` (it is in `alpha` in Kubernetes 1.16) - It can be used to indicate "container not ready *yet*" - process is still starting - loading external data, priming caches - Before Kubernetes 1.16, we had to use the `initialDelaySeconds` parameter (available for both liveness and readiness probes) - `initialDelaySeconds` is a rigid delay (always wait X before running probes) - `startupProbe` works better when a container start time can vary a lot .debug[[k8s/healthchecks.md](https://github.com/BretFisher/kubernetes-mastery/tree/mastery/slides/k8s/healthchecks.md)] --- ## Benefits of using probes - Rolling updates proceed when containers are *actually ready* (as opposed to merely started) - Containers in a broken state get killed and restarted (instead of serving errors or timeouts) - Unavailable backends get removed from load balancer rotation (thus improving response times across the board) - If a probe is not defined, it's as if there was an "always successful" probe .debug[[k8s/healthchecks.md](https://github.com/BretFisher/kubernetes-mastery/tree/mastery/slides/k8s/healthchecks.md)] --- ## Different types of probe handlers - HTTP request - specify URL of the request (and optional headers) - any status code between 200 and 399 indicates success - TCP connection - the probe succeeds if the TCP port is open - arbitrary exec - a command is executed in the container - exit status of zero indicates success .debug[[k8s/healthchecks.md](https://github.com/BretFisher/kubernetes-mastery/tree/mastery/slides/k8s/healthchecks.md)] --- ## Timing and thresholds - Probes are executed at intervals of `periodSeconds` (default: 10) - The timeout for a probe is set with `timeoutSeconds` (default: 1) .warning[If a probe takes longer than that, it is considered as a FAIL] - A probe is considered successful after `successThreshold` successes (default: 1) - A probe is considered failing after `failureThreshold` failures (default: 3) - A probe can have an `initialDelaySeconds` parameter (default: 0) - Kubernetes will wait that amount of time before running the probe for the first time (this is important to avoid killing services that take a long time to start) .debug[[k8s/healthchecks.md](https://github.com/BretFisher/kubernetes-mastery/tree/mastery/slides/k8s/healthchecks.md)] --- ## Example: HTTP probe Here is a pod template for the `rng` web service of the DockerCoins app: ```yaml apiVersion: v1 kind: Pod metadata: name: rng-with-liveness spec: containers: - name: rng image: dockercoins/rng:v0.1 livenessProbe: httpGet: path: / port: 80 initialDelaySeconds: 10 periodSeconds: 1 ``` .small[ If the backend serves an error, or takes longer than 1s, 3 times in a row, it gets killed. ] .debug[[k8s/healthchecks.md](https://github.com/BretFisher/kubernetes-mastery/tree/mastery/slides/k8s/healthchecks.md)] --- ## Example: exec probe Here is a pod template for a Redis server: ```yaml apiVersion: v1 kind: Pod metadata: name: redis-with-liveness spec: containers: - name: redis image: redis livenessProbe: exec: command: ["redis-cli", "ping"] ``` If the Redis process becomes unresponsive, it will be killed. .debug[[k8s/healthchecks.md](https://github.com/BretFisher/kubernetes-mastery/tree/mastery/slides/k8s/healthchecks.md)] --- ## Should probes check container Dependencies? - A HTTP/TCP probe can't check an external dependency -- - But a HTTP URL could kick off code to validate a remote dependency -- - If a web server depends on a database to function, and the database is down: - the web server's liveness probe should succeed - the web server's readiness probe should fail -- - Same thing for any hard dependency (without which the container can't work) -- .warning[**Do not** fail liveness probes for problems that are external to the container] .debug[[k8s/healthchecks.md](https://github.com/BretFisher/kubernetes-mastery/tree/mastery/slides/k8s/healthchecks.md)] --- class: not-mastery ## Healthchecks and dependencies - Liveness checks should not be influenced by the state of external services - All checks should reply quickly (by default, less than 1 second) - Otherwise, they are considered to fail - This might require to check the health of dependencies asynchronously (e.g. if a database or API might be healthy but still take more than 1 second to reply, we should check the status asynchronously and report a cached status) .debug[[k8s/healthchecks.md](https://github.com/BretFisher/kubernetes-mastery/tree/mastery/slides/k8s/healthchecks.md)] --- ## Healthchecks for workers (In that context, worker = process that doesn't accept connections) - Readiness isn't useful (because workers aren't backends for a service) -- - Liveness may help us restart a broken worker, but how can we check it? - Embedding an HTTP server is a (potentially expensive) option -- - Using a "lease" file can be relatively easy: - touch a file during each iteration of the main loop - check the timestamp of that file from an exec probe - Writing logs (and checking them from the probe) also works .debug[[k8s/healthchecks.md](https://github.com/BretFisher/kubernetes-mastery/tree/mastery/slides/k8s/healthchecks.md)] --- ## Questions to ask before adding healthchecks - Do we want liveness, readiness, both? (sometimes, we can use the same check, but with different failure thresholds) -- - Do we have existing HTTP endpoints that we can use? - Do we need to add new endpoints, or perhaps use something else? -- - Are our healthchecks likely to use resources and/or slow down the app? -- - Do they depend on additional services? (this can be particularly tricky) .debug[[k8s/healthchecks.md](https://github.com/BretFisher/kubernetes-mastery/tree/mastery/slides/k8s/healthchecks.md)] --- ## Adding healthchecks to an app - Let's add healthchecks to DockerCoins! - We will examine the questions of the previous slide - Then we will review each component individually to add healthchecks .debug[[k8s/healthchecks-more.md](https://github.com/BretFisher/kubernetes-mastery/tree/mastery/slides/k8s/healthchecks-more.md)] --- ## Liveness, readiness, or both? - To answer that question, we need to see the app run for a while - Do we get temporary, recoverable glitches? → then use readiness - Or do we get hard lock-ups requiring a restart? → then use liveness - In the case of DockerCoins, we don't know yet! - Let's pick liveness .debug[[k8s/healthchecks-more.md](https://github.com/BretFisher/kubernetes-mastery/tree/mastery/slides/k8s/healthchecks-more.md)] --- ## Do we have HTTP endpoints that we can use? - Each of the 3 web services (hasher, rng, webui) has a trivial route on `/` - These routes: - don't seem to perform anything complex or expensive - don't seem to call other services - Perfect! (See next slides for individual details) .debug[[k8s/healthchecks-more.md](https://github.com/BretFisher/kubernetes-mastery/tree/mastery/slides/k8s/healthchecks-more.md)] --- - [hasher.rb](https://github.com/jpetazzo/container.training/blob/master/dockercoins/hasher/hasher.rb) ```ruby get '/' do "HASHER running on #{Socket.gethostname}\n" end ``` - [rng.py](https://github.com/jpetazzo/container.training/blob/master/dockercoins/rng/rng.py) ```python @app.route("/") def index(): return "RNG running on {}\n".format(hostname) ``` - [webui.js](https://github.com/jpetazzo/container.training/blob/master/dockercoins/webui/webui.js) ```javascript app.get('/', function (req, res) { res.redirect('/index.html'); }); ``` .debug[[k8s/healthchecks-more.md](https://github.com/BretFisher/kubernetes-mastery/tree/mastery/slides/k8s/healthchecks-more.md)] --- class: not-mastery ## Running DockerCoins - We will run DockerCoins in a new, separate namespace - We will use a set of YAML manifests and pre-built images - We will add our new liveness probe to the YAML of the `rng` DaemonSet - Then, we will deploy the application .debug[[k8s/healthchecks-more.md](https://github.com/BretFisher/kubernetes-mastery/tree/mastery/slides/k8s/healthchecks-more.md)] --- class: not-mastery ## Creating a new namespace - This will make sure that we don't collide / conflict with previous exercises .exercise[ - Create the yellow namespace: ```bash kubectl create namespace yellow ``` - Switch to that namespace: ```bash kns yellow ``` ] .debug[[k8s/healthchecks-more.md](https://github.com/BretFisher/kubernetes-mastery/tree/mastery/slides/k8s/healthchecks-more.md)] --- ## Retrieving DockerCoins manifests - I've split up the previous `dockercoins.yaml` into one-resource-per-file - This works with the `apply` command, and is easier for humans to manage - Clone them locally so we can add healthchecks and re-apply .exercise[ - Clone that repository: ```bash git clone https://github.com/bretfisher/kubercoins ``` - Change directory to the repository: ```bash cd kubercoins ``` ] .debug[[k8s/healthchecks-more.md](https://github.com/BretFisher/kubernetes-mastery/tree/mastery/slides/k8s/healthchecks-more.md)] --- ## A simple HTTP liveness probe This is what our liveness probe should look like: ```yaml containers: - name: ... image: ... livenessProbe: httpGet: path: / port: 80 initialDelaySeconds: 30 periodSeconds: 5 ``` This will give 30 seconds to the service to start. (Way more than necessary!) <br/> It will run the probe every 5 seconds. <br/> It will use the default timeout (1 second). <br/> It will use the default failure threshold (3 failed attempts = dead). <br/> It will use the default success threshold (1 successful attempt = alive). .debug[[k8s/healthchecks-more.md](https://github.com/BretFisher/kubernetes-mastery/tree/mastery/slides/k8s/healthchecks-more.md)] --- ## Adding the liveness probe - Let's add the liveness probe, then deploy DockerCoins - Remember if you don't have DockerCoins running, this will create - If you already have DockerCoins running, this will update `rng` .exercise[ - Edit `rng-deployment.yaml` and add the liveness probe ```bash vim rng-deployment.yaml ``` - Load the YAML for all the resources of DockerCoins ```bash kubectl apply -f . ``` ] .debug[[k8s/healthchecks-more.md](https://github.com/BretFisher/kubernetes-mastery/tree/mastery/slides/k8s/healthchecks-more.md)] --- ## Testing the liveness probe - The rng service needs 100ms to process a request (because it is single-threaded and sleeps 0.1s in each request) - The probe timeout is set to 1 second - If we send more than 10 requests per second per backend, it will break - Let's generate traffic and see what happens! .exercise[ - Get the ClusterIP address of the rng service: ```bash kubectl get svc rng ``` ] .debug[[k8s/healthchecks-more.md](https://github.com/BretFisher/kubernetes-mastery/tree/mastery/slides/k8s/healthchecks-more.md)] --- ## Monitoring the rng service - Each command below will show us what's happening on a different level .exercise[ - In one window, monitor cluster events: ```bash kubectl get events -w ``` - In another window, monitor pods status: ```bash kubectl get pods -w ``` ] .debug[[k8s/healthchecks-more.md](https://github.com/BretFisher/kubernetes-mastery/tree/mastery/slides/k8s/healthchecks-more.md)] --- ## Generating traffic - Let's use `ab` (Apache Bench) to send concurrent requests to rng .exercise[ - In yet another window, generate traffic using [`shpod`](#shpod): ```bash kubectl attach --namespace=shpod -ti shpod ab -c 10 -n 1000 http://`<ClusterIP>`/1 ``` - Experiment with higher values of `-c` and see what happens ] - The `-c` parameter indicates the number of concurrent requests - The final `/1` is important to generate actual traffic (otherwise we would use the ping endpoint, which doesn't sleep 0.1s per request) .debug[[k8s/healthchecks-more.md](https://github.com/BretFisher/kubernetes-mastery/tree/mastery/slides/k8s/healthchecks-more.md)] --- ## Discussion - Above a given threshold, the liveness probe starts failing (about 10 concurrent requests per backend should be plenty enough) - When the liveness probe fails 3 times in a row, the container is restarted - During the restart, there is *less* capacity available - ... Meaning that the other backends are likely to timeout as well - ... Eventually causing all backends to be restarted - ... And each fresh backend gets restarted, too - This goes on until the load goes down, or we add capacity *This wouldn't be a good healthcheck in a real application!* .debug[[k8s/healthchecks-more.md](https://github.com/BretFisher/kubernetes-mastery/tree/mastery/slides/k8s/healthchecks-more.md)] --- ## Better healthchecks - We need to make sure that the healthcheck doesn't trip when performance degrades due to external pressure - Using a readiness check would have fewer effects (but it would still be an imperfect solution) - A possible combination: - readiness check with a short timeout / low failure threshold - liveness check with a longer timeout / higher failure threshold .debug[[k8s/healthchecks-more.md](https://github.com/BretFisher/kubernetes-mastery/tree/mastery/slides/k8s/healthchecks-more.md)] --- ## Healthchecks for redis - A liveness probe is enough (it's not useful to remove a backend from rotation when it's the only one) - We could use an exec probe running `redis-cli ping` .debug[[k8s/healthchecks-more.md](https://github.com/BretFisher/kubernetes-mastery/tree/mastery/slides/k8s/healthchecks-more.md)] --- class: extra-details ## Exec probes and zombies - When using exec probes, we should make sure that we have a *zombie reaper* 🤔🧐🧟 Wait, what? - When a process terminates, its parent must call `wait()`/`waitpid()` (this is how the parent process retrieves the child's exit status) - In the meantime, the process is in *zombie* state (the process state will show as `Z` in `ps`, `top` ...) - When a process is killed, its children are *orphaned* and attached to PID 1 - PID 1 has the responsibility of *reaping* these processes when they terminate - OK, but how does that affect us? .debug[[k8s/healthchecks-more.md](https://github.com/BretFisher/kubernetes-mastery/tree/mastery/slides/k8s/healthchecks-more.md)] --- class: extra-details ## PID 1 in containers - On ordinary systems, PID 1 (`/sbin/init`) has logic to reap processes - In containers, PID 1 is typically our application process (e.g. Apache, the JVM, NGINX, Redis ...) - These *do not* take care of reaping orphans - If we use exec probes, we need to add a process reaper - We can add [tini](https://github.com/krallin/tini) to our images - Or [share the PID namespace between containers of a pod](https://kubernetes.io/docs/tasks/configure-pod-container/share-process-namespace/) (and have gcr.io/pause take care of the reaping) - Discussion of this in [Video - 10 Ways to Shoot Yourself in the Foot with Kubernetes, #9 Will Surprise You](https://www.youtube.com/watch?v=QKI-JRs2RIE) .debug[[k8s/healthchecks-more.md](https://github.com/BretFisher/kubernetes-mastery/tree/mastery/slides/k8s/healthchecks-more.md)] --- ## Tini and redis ping in a liveness probe 1. Add [tini](https://github.com/krallin/tini) to your own custom redis image 2. Change the kubercoins YAML to use your own image 3. Create a liveness probe in kubercoins YAML 4. Use `exec` handeler and run `tini -s -- redis-cli ping` 5. Example repo here: [github.com/BretFisher/redis-tini](https://github.com/BretFisher/redis-tini) .small[ ```yaml containers: - name: redis image: custom-redis-image livenessProbe: exec: command: - /tini - -s - -- - redis-cli - ping initialDelaySeconds: 30 periodSeconds: 5 ``` ] .debug[[k8s/healthchecks-more.md](https://github.com/BretFisher/kubernetes-mastery/tree/mastery/slides/k8s/healthchecks-more.md)] --- class: pic .interstitial[] --- name: toc-recording-deployment-actions class: title Recording deployment actions .nav[ [Previous section](#toc-healthchecks) | [Back to table of contents](#toc-chapter-5) | [Next section](#toc-namespaces) ] .debug[(automatically generated title slide)] --- # Recording deployment actions - Some commands that modify a Deployment accept an optional `--record` flag (Example: `kubectl set image deployment worker worker=alpine --record`) - That flag will store the command line in the Deployment (Technically, using the annotation `kubernetes.io/change-cause`) - It gets copied to the corresponding ReplicaSet (Allowing to keep track of which command created or promoted this ReplicaSet) - We can view this information with `kubectl rollout history` .debug[[k8s/record.md](https://github.com/BretFisher/kubernetes-mastery/tree/mastery/slides/k8s/record.md)] --- ## Using `--record` - Let's make a couple of changes to a Deployment and record them .exercise[ - Roll back `worker` to image version 0.1: ```bash kubectl set image deployment worker worker=dockercoins/worker:v0.1 --record ``` - Promote it to version 0.2 again: ```bash kubectl set image deployment worker worker=dockercoins/worker:v0.2 --record ``` - View the change history: ```bash kubectl rollout history deployment worker ``` ] .debug[[k8s/record.md](https://github.com/BretFisher/kubernetes-mastery/tree/mastery/slides/k8s/record.md)] --- ## Pitfall #1: forgetting `--record` - What happens if we don't specify `--record`? .exercise[ - Promote `worker` to image version 0.3: ```bash kubectl set image deployment worker worker=dockercoins/worker:v0.3 ``` - View the change history: ```bash kubectl rollout history deployment worker ``` ] -- It recorded version 0.2 instead of 0.3! Why? .debug[[k8s/record.md](https://github.com/BretFisher/kubernetes-mastery/tree/mastery/slides/k8s/record.md)] --- ## How `--record` really works - `kubectl` adds the annotation `kubernetes.io/change-cause` to the Deployment - The Deployment controller copies that annotation to the ReplicaSet - `kubectl rollout history` shows the ReplicaSets' annotations - If we don't specify `--record`, the annotation is not updated - The previous value of that annotation is copied to the new ReplicaSet - In that case, the ReplicaSet annotation does not reflect reality! .debug[[k8s/record.md](https://github.com/BretFisher/kubernetes-mastery/tree/mastery/slides/k8s/record.md)] --- ## Pitfall #2: recording `scale` commands - What happens if we use `kubectl scale --record`? .exercise[ - Check the current history: ```bash kubectl rollout history deployment worker ``` - Scale the deployment: ```bash kubectl scale deployment worker --replicas=3 --record ``` - Check the change history again: ```bash kubectl rollout history deployment worker ``` ] -- The last entry in the history was overwritten by the `scale` command! Why? .debug[[k8s/record.md](https://github.com/BretFisher/kubernetes-mastery/tree/mastery/slides/k8s/record.md)] --- ## Actions that don't create a new ReplicaSet - The `scale` command updates the Deployment definition - But it doesn't create a new ReplicaSet - Using the `--record` flag sets the annotation like before - The annotation gets copied to the existing ReplicaSet - This overwrites the previous annotation that was there - In that case, we lose the previous change cause! .debug[[k8s/record.md](https://github.com/BretFisher/kubernetes-mastery/tree/mastery/slides/k8s/record.md)] --- ## Updating the annotation directly - Let's see what happens if we set the annotation manually .exercise[ - Annotate the Deployment: ```bash kubectl annotate deployment worker kubernetes.io/change-cause="Just for fun" ``` - Check that our annotation shows up in the change history: ```bash kubectl rollout history deployment worker ``` ] -- Our annotation shows up (and overwrote whatever was there before). .debug[[k8s/record.md](https://github.com/BretFisher/kubernetes-mastery/tree/mastery/slides/k8s/record.md)] --- ## Using change cause - It sounds like a good idea to use `--record`, but: *"Incorrect documentation is often worse than no documentation."* <br/> (Bertrand Meyer) - If we use `--record` once, we need to either: - use it every single time after that - or clear the Deployment annotation after using `--record` <br/> (subsequent changes will show up with a `<none>` change cause) - A safer way is to set it through our tooling .debug[[k8s/record.md](https://github.com/BretFisher/kubernetes-mastery/tree/mastery/slides/k8s/record.md)] --- class: pic .interstitial[] --- name: toc-namespaces class: title Namespaces .nav[ [Previous section](#toc-recording-deployment-actions) | [Back to table of contents](#toc-chapter-6) | [Next section](#toc-controlling-a-kubernetes-cluster-remotely) ] .debug[(automatically generated title slide)] --- # Namespaces - We would like to deploy another copy of DockerCoins on our cluster - We could rename all our deployments and services: hasher → hasher2, redis → redis2, rng → rng2, etc. - That would require updating the code - There has to be a better way! -- - As hinted by the title of this section, we will use *namespaces* .debug[[k8s/namespaces.md](https://github.com/BretFisher/kubernetes-mastery/tree/mastery/slides/k8s/namespaces.md)] --- ## Identifying a resource - We cannot have two resources with the same name (or can we...?) -- - We cannot have two resources *of the same kind* with the same name (but it's OK to have an `rng` service, an `rng` deployment, and an `rng` daemon set) -- - We cannot have two resources of the same kind with the same name *in the same namespace* (but it's OK to have e.g. two `rng` services in different namespaces) -- - Except for resources that exist at the *cluster scope* (these do not belong to a namespace) .debug[[k8s/namespaces.md](https://github.com/BretFisher/kubernetes-mastery/tree/mastery/slides/k8s/namespaces.md)] --- ## Uniquely identifying a resource - For *namespaced* resources: the tuple *(kind, name, namespace)* needs to be unique - For resources at the *cluster scope*: the tuple *(kind, name)* needs to be unique .exercise[ - List resource types again, and check the NAMESPACED column: ```bash kubectl api-resources ``` ] .debug[[k8s/namespaces.md](https://github.com/BretFisher/kubernetes-mastery/tree/mastery/slides/k8s/namespaces.md)] --- ## Pre-existing namespaces - If we deploy a cluster with `kubeadm`, we have three or four namespaces: - `default` (for our applications) - `kube-system` (for the control plane) - `kube-public` (contains one ConfigMap for cluster discovery) - `kube-node-lease` (in Kubernetes 1.14 and later; contains Lease objects) - If we deploy differently, we may have different namespaces .debug[[k8s/namespaces.md](https://github.com/BretFisher/kubernetes-mastery/tree/mastery/slides/k8s/namespaces.md)] --- ## Creating namespaces - Let's see two identical methods to create a namespace .exercise[ - We can use `kubectl create namespace`: ```bash kubectl create namespace blue ``` - Or we can construct a very minimal YAML snippet: ```bash kubectl apply -f- <<EOF apiVersion: v1 kind: Namespace metadata: name: blue EOF ``` ] .debug[[k8s/namespaces.md](https://github.com/BretFisher/kubernetes-mastery/tree/mastery/slides/k8s/namespaces.md)] --- ## Using namespaces - We can pass a `-n` or `--namespace` flag to most `kubectl` commands: ```bash kubectl -n blue get svc ``` - We can also change our current *context* - A context is a *(user, cluster, namespace)* tuple - We can manipulate contexts with the `kubectl config` command .debug[[k8s/namespaces.md](https://github.com/BretFisher/kubernetes-mastery/tree/mastery/slides/k8s/namespaces.md)] --- ## Viewing existing contexts - On our training environments, at this point, there should be only one context .exercise[ - View existing contexts to see the cluster name and the current user: ```bash kubectl config get-contexts ``` ] - The current context (the only one!) is tagged with a `*` - What are NAME, CLUSTER, AUTHINFO, and NAMESPACE? .debug[[k8s/namespaces.md](https://github.com/BretFisher/kubernetes-mastery/tree/mastery/slides/k8s/namespaces.md)] --- ## What's in a context - NAME is an arbitrary string to identify the context - CLUSTER is a reference to a cluster (i.e. API endpoint URL, and optional certificate) - AUTHINFO is a reference to the authentication information to use (i.e. a TLS client certificate, token, or otherwise) - NAMESPACE is the namespace (empty string = `default`) .debug[[k8s/namespaces.md](https://github.com/BretFisher/kubernetes-mastery/tree/mastery/slides/k8s/namespaces.md)] --- ## Switching contexts - We want to use a different namespace - Solution 1: update the current context *This is appropriate if we need to change just one thing (e.g. namespace or authentication).* - Solution 2: create a new context and switch to it *This is appropriate if we need to change multiple things and switch back and forth.* - Let's go with solution 1! .debug[[k8s/namespaces.md](https://github.com/BretFisher/kubernetes-mastery/tree/mastery/slides/k8s/namespaces.md)] --- ## Updating a context - This is done through `kubectl config set-context` - We can update a context by passing its name, or the current context with `--current` .exercise[ - Update the current context to use the `blue` namespace: ```bash kubectl config set-context --current --namespace=blue ``` - Check the result: ```bash kubectl config get-contexts ``` ] .debug[[k8s/namespaces.md](https://github.com/BretFisher/kubernetes-mastery/tree/mastery/slides/k8s/namespaces.md)] --- ## Using our new namespace - Let's check that we are in our new namespace, then deploy a new copy of Dockercoins .exercise[ - Verify that the new context is empty: ```bash kubectl get all ``` ] .debug[[k8s/namespaces.md](https://github.com/BretFisher/kubernetes-mastery/tree/mastery/slides/k8s/namespaces.md)] --- ## Deploying DockerCoins with YAML files - The GitHub repository `jpetazzo/kubercoins` contains everything we need! .exercise[ - Clone the kubercoins repository: ```bash cd ~ git clone https://github.com/jpetazzo/kubercoins ``` - Create all the DockerCoins resources: ```bash kubectl create -f kubercoins ``` ] If the argument behind `-f` is a directory, all the files in that directory are processed. The subdirectories are *not* processed, unless we also add the `-R` flag. .debug[[k8s/namespaces.md](https://github.com/BretFisher/kubernetes-mastery/tree/mastery/slides/k8s/namespaces.md)] --- ## Viewing the deployed app - Let's see if this worked correctly! .exercise[ - Retrieve the port number allocated to the `webui` service: ```bash kubectl get svc webui ``` - Point our browser to http://X.X.X.X:3xxxx ] If the graph shows up but stays at zero, give it a minute or two! .debug[[k8s/namespaces.md](https://github.com/BretFisher/kubernetes-mastery/tree/mastery/slides/k8s/namespaces.md)] --- ## Namespaces and isolation - Namespaces *do not* provide isolation - A pod in the `green` namespace can communicate with a pod in the `blue` namespace - A pod in the `default` namespace can communicate with a pod in the `kube-system` namespace - CoreDNS uses a different subdomain for each namespace - Example: from any pod in the cluster, you can connect to the Kubernetes API with: `https://kubernetes.default.svc.cluster.local:443/` .debug[[k8s/namespaces.md](https://github.com/BretFisher/kubernetes-mastery/tree/mastery/slides/k8s/namespaces.md)] --- ## Isolating pods - Actual isolation is implemented with *network policies* - Network policies are resources (like deployments, services, namespaces...) - Network policies specify which flows are allowed: - between pods - from pods to the outside world - and vice-versa .debug[[k8s/namespaces.md](https://github.com/BretFisher/kubernetes-mastery/tree/mastery/slides/k8s/namespaces.md)] --- ## Switch back to the default namespace - Let's make sure that we don't run future exercises in the `blue` namespace .exercise[ - Switch back to the original context: ```bash kubectl config set-context --current --namespace= ``` ] Note: we could have used `--namespace=default` for the same result. .debug[[k8s/namespaces.md](https://github.com/BretFisher/kubernetes-mastery/tree/mastery/slides/k8s/namespaces.md)] --- ## Switching namespaces more easily - We can also use a little helper tool called `kubens`: ```bash # Switch to namespace foo kubens foo # Switch back to the previous namespace kubens - ``` - On our clusters, `kubens` is called `kns` instead (so that it's even fewer keystrokes to switch namespaces) .debug[[k8s/namespaces.md](https://github.com/BretFisher/kubernetes-mastery/tree/mastery/slides/k8s/namespaces.md)] --- ## `kubens` and `kubectx` - With `kubens`, we can switch quickly between namespaces - With `kubectx`, we can switch quickly between contexts - Both tools are simple shell scripts available from https://github.com/ahmetb/kubectx - On our clusters, they are installed as `kns` and `kctx` (for brevity and to avoid completion clashes between `kubectx` and `kubectl`) .debug[[k8s/namespaces.md](https://github.com/BretFisher/kubernetes-mastery/tree/mastery/slides/k8s/namespaces.md)] --- ## `kube-ps1` - It's easy to lose track of our current cluster / context / namespace - `kube-ps1` makes it easy to track these, by showing them in our shell prompt - It is installed on our training clusters, and when using [shpod](https://github.com/jpetazzo/shpod) - It gives us a prompt looking like this one: ``` [123.45.67.89] `(kubernetes-admin@kubernetes:default)` docker@node1 ~ ``` (The highlighted part is `context:namespace`, managed by `kube-ps1`) - Highly recommended if you work across multiple contexts or namespaces! .debug[[k8s/namespaces.md](https://github.com/BretFisher/kubernetes-mastery/tree/mastery/slides/k8s/namespaces.md)] --- ## Installing `kube-ps1` - It's a simple shell script available from https://github.com/jonmosco/kube-ps1 - It needs to be [installed in our profile/rc files](https://github.com/jonmosco/kube-ps1#installing) (instructions differ depending on platform, shell, etc.) - Once installed, it defines aliases called `kube_ps1`, `kubeon`, `kubeoff` (to selectively enable/disable it when needed) - Pro-tip: install it on your machine during the next break! .debug[[k8s/namespaces.md](https://github.com/BretFisher/kubernetes-mastery/tree/mastery/slides/k8s/namespaces.md)] --- class: pic .interstitial[] --- name: toc-controlling-a-kubernetes-cluster-remotely class: title Controlling a Kubernetes cluster remotely .nav[ [Previous section](#toc-namespaces) | [Back to table of contents](#toc-chapter-6) | [Next section](#toc-accessing-internal-services) ] .debug[(automatically generated title slide)] --- # Controlling a Kubernetes cluster remotely - `kubectl` can be used either on cluster instances or outside the cluster - Here, we are going to use `kubectl` from our local machine .debug[[k8s/localkubeconfig.md](https://github.com/BretFisher/kubernetes-mastery/tree/mastery/slides/k8s/localkubeconfig.md)] --- ## Requirements .warning[The exercises in this chapter should be done *on your local machine*.] - `kubectl` is officially available on Linux, macOS, Windows (and unofficially anywhere we can build and run Go binaries) - You may skip these exercises if you are following along from: - a tablet or phone - a web-based terminal - an environment where you can't install and run new binaries .debug[[k8s/localkubeconfig.md](https://github.com/BretFisher/kubernetes-mastery/tree/mastery/slides/k8s/localkubeconfig.md)] --- ## Installing `kubectl` - If you already have `kubectl` on your local machine, you can skip this .exercise[ <!-- ##VERSION## --> - Download the `kubectl` binary from one of these links: [Linux](https://storage.googleapis.com/kubernetes-release/release/v1.15.3/bin/linux/amd64/kubectl) | [macOS](https://storage.googleapis.com/kubernetes-release/release/v1.15.3/bin/darwin/amd64/kubectl) | [Windows](https://storage.googleapis.com/kubernetes-release/release/v1.15.3/bin/windows/amd64/kubectl.exe) - On Linux and macOS, make the binary executable with `chmod +x kubectl` (And remember to run it with `./kubectl` or move it to your `$PATH`) ] Note: if you are following along with a different platform (e.g. Linux on an architecture different from amd64, or with a phone or tablet), installing `kubectl` might be more complicated (or even impossible) so feel free to skip this section. .debug[[k8s/localkubeconfig.md](https://github.com/BretFisher/kubernetes-mastery/tree/mastery/slides/k8s/localkubeconfig.md)] --- ## Testing `kubectl` - Check that `kubectl` works correctly (before even trying to connect to a remote cluster!) .exercise[ - Ask `kubectl` to show its version number: ```bash kubectl version --client ``` ] The output should look like this: ``` Client Version: version.Info{Major:"1", Minor:"15", GitVersion:"v1.15.0", GitCommit:"e8462b5b5dc2584fdcd18e6bcfe9f1e4d970a529", GitTreeState:"clean", BuildDate:"2019-06-19T16:40:16Z", GoVersion:"go1.12.5", Compiler:"gc", Platform:"darwin/amd64"} ``` .debug[[k8s/localkubeconfig.md](https://github.com/BretFisher/kubernetes-mastery/tree/mastery/slides/k8s/localkubeconfig.md)] --- ## Preserving the existing `~/.kube/config` - If you already have a `~/.kube/config` file, rename it (we are going to overwrite it in the following slides!) - If you never used `kubectl` on your machine before: nothing to do! .exercise[ - Make a copy of `~/.kube/config`; if you are using macOS or Linux, you can do: ```bash cp ~/.kube/config ~/.kube/config.before.training ``` - If you are using Windows, you will need to adapt this command ] .debug[[k8s/localkubeconfig.md](https://github.com/BretFisher/kubernetes-mastery/tree/mastery/slides/k8s/localkubeconfig.md)] --- ## Copying the configuration file from `node1` - The `~/.kube/config` file that is on `node1` contains all the credentials we need - Let's copy it over! .exercise[ - Copy the file from `node1`; if you are using macOS or Linux, you can do: ``` scp `USER`@`X.X.X.X`:.kube/config ~/.kube/config # Make sure to replace X.X.X.X with the IP address of node1, # and USER with the user name used to log into node1! ``` - If you are using Windows, adapt these instructions to your SSH client ] .debug[[k8s/localkubeconfig.md](https://github.com/BretFisher/kubernetes-mastery/tree/mastery/slides/k8s/localkubeconfig.md)] --- ## Updating the server address - There is a good chance that we need to update the server address - To know if it is necessary, run `kubectl config view` - Look for the `server:` address: - if it matches the public IP address of `node1`, you're good! - if it is anything else (especially a private IP address), update it! - To update the server address, run: ```bash kubectl config set-cluster kubernetes --server=https://`X.X.X.X`:6443 # Make sure to replace X.X.X.X with the IP address of node1! ``` .debug[[k8s/localkubeconfig.md](https://github.com/BretFisher/kubernetes-mastery/tree/mastery/slides/k8s/localkubeconfig.md)] --- class: extra-details ## What if we get a certificate error? - Generally, the Kubernetes API uses a certificate that is valid for: - `kubernetes` - `kubernetes.default` - `kubernetes.default.svc` - `kubernetes.default.svc.cluster.local` - the ClusterIP address of the `kubernetes` service - the hostname of the node hosting the control plane (e.g. `node1`) - the IP address of the node hosting the control plane - On most clouds, the IP address of the node is an internal IP address - ... And we are going to connect over the external IP address - ... And that external IP address was not used when creating the certificate! .debug[[k8s/localkubeconfig.md](https://github.com/BretFisher/kubernetes-mastery/tree/mastery/slides/k8s/localkubeconfig.md)] --- class: extra-details ## Working around the certificate error - We need to tell `kubectl` to skip TLS verification (only do this with testing clusters, never in production!) - The following command will do the trick: ```bash kubectl config set-cluster kubernetes --insecure-skip-tls-verify ``` .debug[[k8s/localkubeconfig.md](https://github.com/BretFisher/kubernetes-mastery/tree/mastery/slides/k8s/localkubeconfig.md)] --- ## Checking that we can connect to the cluster - We can now run a couple of trivial commands to check that all is well .exercise[ - Check the versions of the local client and remote server: ```bash kubectl version ``` - View the nodes of the cluster: ```bash kubectl get nodes ``` ] We can now utilize the cluster exactly as if we're logged into a node, except that it's remote. .debug[[k8s/localkubeconfig.md](https://github.com/BretFisher/kubernetes-mastery/tree/mastery/slides/k8s/localkubeconfig.md)] --- class: pic .interstitial[] --- name: toc-accessing-internal-services class: title Accessing internal services .nav[ [Previous section](#toc-controlling-a-kubernetes-cluster-remotely) | [Back to table of contents](#toc-chapter-6) | [Next section](#toc-accessing-the-api-with-kubectl-proxy) ] .debug[(automatically generated title slide)] --- # Accessing internal services - When we are logged in on a cluster node, we can access internal services (by virtue of the Kubernetes network model: all nodes can reach all pods and services) - When we are accessing a remote cluster, things are different (generally, our local machine won't have access to the cluster's internal subnet) - How can we temporarily access a service without exposing it to everyone? -- - `kubectl proxy`: gives us access to the API, which includes a proxy for HTTP resources - `kubectl port-forward`: allows forwarding of TCP ports to arbitrary pods, services, ... .debug[[k8s/accessinternal.md](https://github.com/BretFisher/kubernetes-mastery/tree/mastery/slides/k8s/accessinternal.md)] --- ## Suspension of disbelief The exercises in this section assume that we have set up `kubectl` on our local machine in order to access a remote cluster. We will therefore show how to access services and pods of the remote cluster, from our local machine. You can also run these exercises directly on the cluster (if you haven't installed and set up `kubectl` locally). Running commands locally will be less useful (since you could access services and pods directly), but keep in mind that these commands will work anywhere as long as you have installed and set up `kubectl` to communicate with your cluster. .debug[[k8s/accessinternal.md](https://github.com/BretFisher/kubernetes-mastery/tree/mastery/slides/k8s/accessinternal.md)] --- ## `kubectl proxy` in theory - Running `kubectl proxy` gives us access to the entire Kubernetes API - The API includes routes to proxy HTTP traffic - These routes look like the following: `/api/v1/namespaces/<namespace>/services/<service>/proxy` - We just add the URI to the end of the request, for instance: `/api/v1/namespaces/<namespace>/services/<service>/proxy/index.html` - We can access `services` and `pods` this way .debug[[k8s/accessinternal.md](https://github.com/BretFisher/kubernetes-mastery/tree/mastery/slides/k8s/accessinternal.md)] --- ## `kubectl proxy` in practice - Let's access the `webui` service through `kubectl proxy` .exercise[ - Run an API proxy in the background: ```bash kubectl proxy & ``` - Access the `webui` service: ```bash curl localhost:8001/api/v1/namespaces/default/services/webui/proxy/index.html ``` - Terminate the proxy: ```bash kill %1 ``` ] .debug[[k8s/accessinternal.md](https://github.com/BretFisher/kubernetes-mastery/tree/mastery/slides/k8s/accessinternal.md)] --- ## `kubectl port-forward` in theory - What if we want to access a TCP service? - We can use `kubectl port-forward` instead - It will create a TCP relay to forward connections to a specific port (of a pod, service, deployment...) - The syntax is: `kubectl port-forward service/name_of_service local_port:remote_port` - If only one port number is specified, it is used for both local and remote ports .debug[[k8s/accessinternal.md](https://github.com/BretFisher/kubernetes-mastery/tree/mastery/slides/k8s/accessinternal.md)] --- ## `kubectl port-forward` in practice - Let's access our remote Redis server .exercise[ - Forward connections from local port 10000 to remote port 6379: ```bash kubectl port-forward svc/redis 10000:6379 & ``` - Connect to the Redis server: ```bash telnet localhost 10000 ``` - Issue a few commands, e.g. `INFO server` then `QUIT` <!-- ```wait Connected to localhost``` ```keys INFO server``` ```key ^J``` ```keys QUIT``` ```key ^J``` --> - Terminate the port forwarder: ```bash kill %1 ``` ] .debug[[k8s/accessinternal.md](https://github.com/BretFisher/kubernetes-mastery/tree/mastery/slides/k8s/accessinternal.md)] --- class: pic .interstitial[] --- name: toc-accessing-the-api-with-kubectl-proxy class: title Accessing the API with `kubectl proxy` .nav[ [Previous section](#toc-accessing-internal-services) | [Back to table of contents](#toc-chapter-6) | [Next section](#toc-exposing-http-services-with-ingress-resources) ] .debug[(automatically generated title slide)] --- # Accessing the API with `kubectl proxy` - The API requires us to authenticate.red[¹] - There are many authentication methods available, including: - TLS client certificates <br/> (that's what we've used so far) - HTTP basic password authentication <br/> (from a static file; not recommended) - various token mechanisms <br/> (detailed in the [documentation](https://kubernetes.io/docs/reference/access-authn-authz/authentication/#authentication-strategies)) .red[¹]OK, we lied. If you don't authenticate, you are considered to be user `system:anonymous`, which doesn't have any access rights by default. .debug[[k8s/kubectlproxy.md](https://github.com/BretFisher/kubernetes-mastery/tree/mastery/slides/k8s/kubectlproxy.md)] --- ## Accessing the API directly - Let's see what happens if we try to access the API directly with `curl` .exercise[ - Retrieve the ClusterIP allocated to the `kubernetes` service: ```bash kubectl get svc kubernetes ``` - Replace the IP below and try to connect with `curl`: ```bash curl -k https://`10.96.0.1`/ ``` ] The API will tell us that user `system:anonymous` cannot access this path. .debug[[k8s/kubectlproxy.md](https://github.com/BretFisher/kubernetes-mastery/tree/mastery/slides/k8s/kubectlproxy.md)] --- ## Authenticating to the API If we wanted to talk to the API, we would need to: - extract our TLS key and certificate information from `~/.kube/config` (the information is in PEM format, encoded in base64) - use that information to present our certificate when connecting (for instance, with `openssl s_client -key ... -cert ... -connect ...`) - figure out exactly which credentials to use (once we start juggling multiple clusters) - change that whole process if we're using another authentication method 🤔 There has to be a better way! .debug[[k8s/kubectlproxy.md](https://github.com/BretFisher/kubernetes-mastery/tree/mastery/slides/k8s/kubectlproxy.md)] --- ## Using `kubectl proxy` for authentication - `kubectl proxy` runs a proxy in the foreground - This proxy lets us access the Kubernetes API without authentication (`kubectl proxy` adds our credentials on the fly to the requests) - This proxy lets us access the Kubernetes API over plain HTTP - This is a great tool to learn and experiment with the Kubernetes API - ... And for serious uses as well (suitable for one-shot scripts) - For unattended use, it's better to create a [service account](https://kubernetes.io/docs/tasks/configure-pod-container/configure-service-account/) .debug[[k8s/kubectlproxy.md](https://github.com/BretFisher/kubernetes-mastery/tree/mastery/slides/k8s/kubectlproxy.md)] --- ## Trying `kubectl proxy` - Let's start `kubectl proxy` and then do a simple request with `curl`! .exercise[ - Start `kubectl proxy` in the background: ```bash kubectl proxy & ``` - Access the API's default route: ```bash curl localhost:8001 ``` <!-- ```wait /version``` ```key ^J``` --> - Terminate the proxy: ```bash kill %1 ``` ] The output is a list of available API routes. .debug[[k8s/kubectlproxy.md](https://github.com/BretFisher/kubernetes-mastery/tree/mastery/slides/k8s/kubectlproxy.md)] --- ## OpenAPI (fka Swagger) - The Kubernetes API serves an OpenAPI Specification (OpenAPI was formerly known as Swagger) - OpenAPI has many advantages (generate client library code, generate test code ...) - For us, this means we can explore the API with [Swagger UI](https://swagger.io/tools/swagger-ui/) (for instance with the [Swagger UI add-on for Firefox](https://addons.mozilla.org/en-US/firefox/addon/swagger-ui-ff/)) .debug[[k8s/kubectlproxy.md](https://github.com/BretFisher/kubernetes-mastery/tree/mastery/slides/k8s/kubectlproxy.md)] --- ## `kubectl proxy` is intended for local use - By default, the proxy listens on port 8001 (But this can be changed, or we can tell `kubectl proxy` to pick a port) - By default, the proxy binds to `127.0.0.1` (Making it unreachable from other machines, for security reasons) - By default, the proxy only accepts connections from: `^localhost$,^127\.0\.0\.1$,^\[::1\]$` - This is great when running `kubectl proxy` locally - Not-so-great when you want to connect to the proxy from a remote machine .debug[[k8s/kubectlproxy.md](https://github.com/BretFisher/kubernetes-mastery/tree/mastery/slides/k8s/kubectlproxy.md)] --- class: extra-details ## Running `kubectl proxy` on a remote machine - If we wanted to connect to the proxy from another machine, we would need to: - bind to `INADDR_ANY` instead of `127.0.0.1` - accept connections from any address - This is achieved with: ``` kubectl proxy --port=8888 --address=0.0.0.0 --accept-hosts=.* ``` .warning[Do not do this on a real cluster: it opens full unauthenticated access!] .debug[[k8s/kubectlproxy.md](https://github.com/BretFisher/kubernetes-mastery/tree/mastery/slides/k8s/kubectlproxy.md)] --- class: extra-details ## Security considerations - Running `kubectl proxy` openly is a huge security risk - It is slightly better to run the proxy where you need it (and copy credentials, e.g. `~/.kube/config`, to that place) - It is even better to use a limited account with reduced permissions .debug[[k8s/kubectlproxy.md](https://github.com/BretFisher/kubernetes-mastery/tree/mastery/slides/k8s/kubectlproxy.md)] --- ## Good to know ... - `kubectl proxy` also gives access to all internal services - Specifically, services are exposed as such: ``` /api/v1/namespaces/<namespace>/services/<service>/proxy ``` - We can use `kubectl proxy` to access an internal service in a pinch (or, for non HTTP services, `kubectl port-forward`) - This is not very useful when running `kubectl` directly on the cluster (since we could connect to the services directly anyway) - But it is very powerful as soon as you run `kubectl` from a remote machine .debug[[k8s/kubectlproxy.md](https://github.com/BretFisher/kubernetes-mastery/tree/mastery/slides/k8s/kubectlproxy.md)] --- class: pic .interstitial[] --- name: toc-exposing-http-services-with-ingress-resources class: title Exposing HTTP services with Ingress resources .nav[ [Previous section](#toc-accessing-the-api-with-kubectl-proxy) | [Back to table of contents](#toc-chapter-7) | [Next section](#toc-kustomize) ] .debug[(automatically generated title slide)] --- # Exposing HTTP services with Ingress resources - *Services* give us a way to access a pod or a set of pods - Services can be exposed to the outside world: - with type `NodePort` (on a port >30000) - with type `LoadBalancer` (allocating an external load balancer) - What about HTTP services? - how can we expose `webui`, `rng`, `hasher`? - the Kubernetes dashboard? - a new version of `webui`? .debug[[k8s/ingress.md](https://github.com/BretFisher/kubernetes-mastery/tree/mastery/slides/k8s/ingress.md)] --- ## Exposing HTTP services - If we use `NodePort` services, clients have to specify port numbers (i.e. http://xxxxx:31234 instead of just http://xxxxx) - `LoadBalancer` services are nice, but: - they are not available in all environments - they often carry an additional cost (e.g. they provision an ELB) - They often work at OSI Layer 4 (IP+Port) and not Layer 7 (HTTP/S) - they require one extra step for DNS integration <br/> (waiting for the `LoadBalancer` to be provisioned; then adding it to DNS) - We could build our own reverse proxy .debug[[k8s/ingress.md](https://github.com/BretFisher/kubernetes-mastery/tree/mastery/slides/k8s/ingress.md)] --- ## Building a custom reverse proxy - There are many options available: Apache, HAProxy, Hipache, NGINX, Traefik, ... - Most of these options require us to update/edit configuration files after each change - Some of them can pick up virtual hosts and backends from a configuration store - Wouldn't it be nice if this configuration could be managed with the Kubernetes API? -- - Enter.red[¹] *Ingress* resources! .footnote[.red[¹] Pun maybe intended.] .debug[[k8s/ingress.md](https://github.com/BretFisher/kubernetes-mastery/tree/mastery/slides/k8s/ingress.md)] --- ## Ingress resources - Kubernetes API resource (`kubectl get ingress`/`ingresses`/`ing`) - Designed to expose HTTP services - Basic features: - load balancing - SSL termination - name-based virtual hosting - Can also route to different services depending on: - URI path (e.g. `/api`→`api-service`, `/static`→`assets-service`) - Client headers, including cookies (for A/B testing, canary deployment...) - and more! .debug[[k8s/ingress.md](https://github.com/BretFisher/kubernetes-mastery/tree/mastery/slides/k8s/ingress.md)] --- ## Principle of operation - Step 1: deploy an *ingress controller* - ingress controller = load balancer + control loop - the control loop watches over ingress resources, and configures the LB accordingly - Step 2: set up DNS - associate DNS entries with the load balancer address - Step 3: create *ingress resources* - the ingress controller picks up these resources and configures the LB - Step 4: profit! .debug[[k8s/ingress.md](https://github.com/BretFisher/kubernetes-mastery/tree/mastery/slides/k8s/ingress.md)] --- ## Ingress in action - We will deploy the Traefik ingress controller - this is an arbitrary choice - maybe motivated by the fact that Traefik releases are named after cheeses - For DNS, we will use [nip.io](http://nip.io/) - `*.1.2.3.4.nip.io` resolves to `1.2.3.4` - We will create ingress resources for various HTTP services .debug[[k8s/ingress.md](https://github.com/BretFisher/kubernetes-mastery/tree/mastery/slides/k8s/ingress.md)] --- ## Deploying pods listening on port 80 - We want our ingress load balancer to be available on port 80 - The best way to do that would be with a `LoadBalancer` service ... but it requires support from the underlying infrastructure - Instead, we are going to use the `hostNetwork` mode on the Traefik pods - Let's see what this `hostNetwork` mode is about ... .debug[[k8s/ingress.md](https://github.com/BretFisher/kubernetes-mastery/tree/mastery/slides/k8s/ingress.md)] --- ## Without `hostNetwork` - Normally, each pod gets its own *network namespace* (sometimes called sandbox or network sandbox) - An IP address is assigned to the pod - This IP address is routed/connected to the cluster network - All containers of that pod are sharing that network namespace (and therefore using the same IP address) .debug[[k8s/ingress.md](https://github.com/BretFisher/kubernetes-mastery/tree/mastery/slides/k8s/ingress.md)] --- ## With `hostNetwork: true` - No network namespace gets created - The pod is using the network namespace of the host - It "sees" (and can use) the interfaces (and IP addresses) of the host - The pod can receive outside traffic directly, on any port - Downside: with most network plugins, network policies won't work for that pod - most network policies work at the IP address level - filtering that pod = filtering traffic from the node .debug[[k8s/ingress.md](https://github.com/BretFisher/kubernetes-mastery/tree/mastery/slides/k8s/ingress.md)] --- class: extra-details ## Other techniques to expose port 80 - We could use pods specifying `hostPort: 80` ... but with most CNI plugins, this [doesn't work or requires additional setup](https://github.com/kubernetes/kubernetes/issues/23920) - We could use a `NodePort` service ... but that requires [changing the `--service-node-port-range` flag in the API server](https://kubernetes.io/docs/reference/command-line-tools-reference/kube-apiserver/) - We could create a service with an external IP ... this would work, but would require a few extra steps (figuring out the IP address and adding it to the service) .debug[[k8s/ingress.md](https://github.com/BretFisher/kubernetes-mastery/tree/mastery/slides/k8s/ingress.md)] --- ## Running Traefik - The [Traefik documentation](https://docs.traefik.io/user-guide/kubernetes/#deploy-trfik-using-a-deployment-or-daemonset) tells us to pick between Deployment and Daemon Set - We are going to use a Daemon Set so that each node can accept connections - We will do two minor changes to the [YAML provided by Traefik](https://github.com/containous/traefik/blob/v1.7/examples/k8s/traefik-ds.yaml): - enable `hostNetwork` - add a *toleration* so that Traefik also runs on `node1` .debug[[k8s/ingress.md](https://github.com/BretFisher/kubernetes-mastery/tree/mastery/slides/k8s/ingress.md)] --- ## Taints and tolerations - A *taint* is an attribute added to a node - It prevents pods from running on the node - ... Unless they have a matching *toleration* - When deploying with `kubeadm`: - a taint is placed on the node dedicated to the control plane - the pods running the control plane have a matching toleration .debug[[k8s/ingress.md](https://github.com/BretFisher/kubernetes-mastery/tree/mastery/slides/k8s/ingress.md)] --- class: extra-details ## Checking taints on our nodes .exercise[ - Check our nodes specs: ```bash kubectl get node node1 -o json | jq .spec kubectl get node node2 -o json | jq .spec ``` ] We should see a result only for `node1` (the one with the control plane): ```json "taints": [ { "effect": "NoSchedule", "key": "node-role.kubernetes.io/master" } ] ``` .debug[[k8s/ingress.md](https://github.com/BretFisher/kubernetes-mastery/tree/mastery/slides/k8s/ingress.md)] --- class: extra-details ## Understanding a taint - The `key` can be interpreted as: - a reservation for a special set of pods <br/> (here, this means "this node is reserved for the control plane") - an error condition on the node <br/> (for instance: "disk full," do not start new pods here!) - The `effect` can be: - `NoSchedule` (don't run new pods here) - `PreferNoSchedule` (try not to run new pods here) - `NoExecute` (don't run new pods and evict running pods) .debug[[k8s/ingress.md](https://github.com/BretFisher/kubernetes-mastery/tree/mastery/slides/k8s/ingress.md)] --- class: extra-details ## Checking tolerations on the control plane .exercise[ - Check tolerations for CoreDNS: ```bash kubectl -n kube-system get deployments coredns -o json | jq .spec.template.spec.tolerations ``` ] The result should include: ```json { "effect": "NoSchedule", "key": "node-role.kubernetes.io/master" } ``` It means: "bypass the exact taint that we saw earlier on `node1`." .debug[[k8s/ingress.md](https://github.com/BretFisher/kubernetes-mastery/tree/mastery/slides/k8s/ingress.md)] --- class: extra-details ## Special tolerations .exercise[ - Check tolerations on `kube-proxy`: ```bash kubectl -n kube-system get ds kube-proxy -o json | jq .spec.template.spec.tolerations ``` ] The result should include: ```json { "operator": "Exists" } ``` This one is a special case that means "ignore all taints and run anyway." .debug[[k8s/ingress.md](https://github.com/BretFisher/kubernetes-mastery/tree/mastery/slides/k8s/ingress.md)] --- ## Running Traefik on our cluster - We provide a YAML file (`k8s/traefik.yaml`) which is essentially the sum of: - [Traefik's Daemon Set resources](https://github.com/containous/traefik/blob/v1.7/examples/k8s/traefik-ds.yaml) (patched with `hostNetwork` and tolerations) - [Traefik's RBAC rules](https://github.com/containous/traefik/blob/v1.7/examples/k8s/traefik-rbac.yaml) allowing it to watch necessary API objects .exercise[ - Apply the YAML: ```bash kubectl apply -f ~/container.training/k8s/traefik.yaml ``` ] .debug[[k8s/ingress.md](https://github.com/BretFisher/kubernetes-mastery/tree/mastery/slides/k8s/ingress.md)] --- ## Checking that Traefik runs correctly - If Traefik started correctly, we now have a web server listening on each node .exercise[ - Check that Traefik is serving 80/tcp: ```bash curl localhost ``` ] We should get a `404 page not found` error. This is normal: we haven't provided any ingress rule yet. .debug[[k8s/ingress.md](https://github.com/BretFisher/kubernetes-mastery/tree/mastery/slides/k8s/ingress.md)] --- ## Setting up DNS - To make our lives easier, we will use [nip.io](http://nip.io) - Check out `http://cheddar.A.B.C.D.nip.io` (replacing A.B.C.D with the IP address of `node1`) - We should get the same `404 page not found` error (meaning that our DNS is "set up properly", so to speak!) .debug[[k8s/ingress.md](https://github.com/BretFisher/kubernetes-mastery/tree/mastery/slides/k8s/ingress.md)] --- ## Traefik web UI - Traefik provides a web dashboard - With the current install method, it's listening on port 8080 .exercise[ - Go to `http://node1:8080` (replacing `node1` with its IP address) <!-- ```open http://node1:8080``` --> ] .debug[[k8s/ingress.md](https://github.com/BretFisher/kubernetes-mastery/tree/mastery/slides/k8s/ingress.md)] --- ## Setting up host-based routing ingress rules - We are going to use `errm/cheese` images (there are [3 tags available](https://hub.docker.com/r/errm/cheese/tags/): wensleydale, cheddar, stilton) - These images contain a simple static HTTP server sending a picture of cheese - We will run 3 deployments (one for each cheese) - We will create 3 services (one for each deployment) - Then we will create 3 ingress rules (one for each service) - We will route `<name-of-cheese>.A.B.C.D.nip.io` to the corresponding deployment .debug[[k8s/ingress.md](https://github.com/BretFisher/kubernetes-mastery/tree/mastery/slides/k8s/ingress.md)] --- ## Running cheesy web servers .exercise[ - Run all three deployments: ```bash kubectl create deployment cheddar --image=errm/cheese:cheddar kubectl create deployment stilton --image=errm/cheese:stilton kubectl create deployment wensleydale --image=errm/cheese:wensleydale ``` - Create a service for each of them: ```bash kubectl expose deployment cheddar --port=80 kubectl expose deployment stilton --port=80 kubectl expose deployment wensleydale --port=80 ``` ] .debug[[k8s/ingress.md](https://github.com/BretFisher/kubernetes-mastery/tree/mastery/slides/k8s/ingress.md)] --- ## What does an ingress resource look like? Here is a minimal host-based ingress resource: ```yaml apiVersion: networking.k8s.io/v1 kind: Ingress metadata: name: cheddar spec: rules: - host: cheddar.`A.B.C.D`.nip.io http: paths: - path: / pathType: Prefix backend: service: name: cheddar port: number: 80 ``` (It is in `k8s/ingress.yaml`.) .debug[[k8s/ingress.md](https://github.com/BretFisher/kubernetes-mastery/tree/mastery/slides/k8s/ingress.md)] --- ## Creating our first ingress resources .exercise[ - Edit the file `~/container.training/k8s/ingress.yaml` - Replace A.B.C.D with the IP address of `node1` - Apply the file - Open http://cheddar.A.B.C.D.nip.io ] (An image of a piece of cheese should show up.) .debug[[k8s/ingress.md](https://github.com/BretFisher/kubernetes-mastery/tree/mastery/slides/k8s/ingress.md)] --- ## Creating the other ingress resources .exercise[ - Edit the file `~/container.training/k8s/ingress.yaml` - Replace `cheddar` with `stilton` (in `name`, `host`, `serviceName`) - Apply the file - Check that `stilton.A.B.C.D.nip.io` works correctly - Repeat for `wensleydale` ] .debug[[k8s/ingress.md](https://github.com/BretFisher/kubernetes-mastery/tree/mastery/slides/k8s/ingress.md)] --- ## Using multiple ingress controllers - You can have multiple ingress controllers active simultaneously (e.g. Traefik and NGINX) - You can even have multiple instances of the same controller (e.g. one for internal, another for external traffic) - The `kubernetes.io/ingress.class` annotation can be used to tell which one to use - It's OK if multiple ingress controllers configure the same resource (it just means that the service will be accessible through multiple paths) .debug[[k8s/ingress.md](https://github.com/BretFisher/kubernetes-mastery/tree/mastery/slides/k8s/ingress.md)] --- ## Ingress: the good - The traffic flows directly from the ingress load balancer to the backends - it doesn't need to go through the `ClusterIP` - in fact, we don't even need a `ClusterIP` (we can use a headless service) - The load balancer can be outside of Kubernetes (as long as it has access to the cluster subnet) - This allows the use of external (hardware, physical machines...) load balancers - Annotations can encode special features (rate-limiting, A/B testing, session stickiness, etc.) .debug[[k8s/ingress.md](https://github.com/BretFisher/kubernetes-mastery/tree/mastery/slides/k8s/ingress.md)] --- ## Ingress: the bad - Aforementioned "special features" are not standardized yet - Some controllers will support them; some won't - Even relatively common features (stripping a path prefix) can differ: - [traefik.ingress.kubernetes.io/rule-type: PathPrefixStrip](https://docs.traefik.io/user-guide/kubernetes/#path-based-routing) - [ingress.kubernetes.io/rewrite-target: /](https://github.com/kubernetes/contrib/tree/master/ingress/controllers/nginx/examples/rewrite) - This should eventually stabilize (remember that ingresses are currently `apiVersion: networking.k8s.io/v1beta1`) .debug[[k8s/ingress.md](https://github.com/BretFisher/kubernetes-mastery/tree/mastery/slides/k8s/ingress.md)] --- ## A special feature in action - We're going to see how to implement *canary releases* with Traefik - This feature is available on multiple ingress controllers - ... But it is configured very differently on each of them .debug[[k8s/ingress.md](https://github.com/BretFisher/kubernetes-mastery/tree/mastery/slides/k8s/ingress.md)] --- ## Canary releases - A *canary release* (or canary launch or canary deployment) is a release that will process only a small fraction of the workload - After deploying the canary, we compare its metrics to the normal release - If the metrics look good, the canary will progressively receive more traffic (until it gets 100% and becomes the new normal release) - If the metrics aren't good, the canary is automatically removed - When we deploy a bad release, only a tiny fraction of traffic is affected .debug[[k8s/ingress.md](https://github.com/BretFisher/kubernetes-mastery/tree/mastery/slides/k8s/ingress.md)] --- ## Various ways to implement canary - Example 1: canary for a microservice - 1% of all requests (sampled randomly) are sent to the canary - the remaining 99% are sent to the normal release - Example 2: canary for a web app - 1% of users are sent to the canary web site - the remaining 99% are sent to the normal release - Example 3: canary for shipping physical goods - 1% of orders are shipped with the canary process - the reamining 99% are shipped with the normal process - We're going to implement example 1 (per-request routing) .debug[[k8s/ingress.md](https://github.com/BretFisher/kubernetes-mastery/tree/mastery/slides/k8s/ingress.md)] --- ## Canary releases with Traefik - We need to deploy the canary and expose it with a separate service - Then, in the Ingress resource, we need: - multiple `paths` entries (one for each service, canary and normal) - an extra annotation indicating the weight of each service - If we want, we can send requests to more than 2 services - Let's send requests to our 3 cheesy services! .exercise[ - Create the resource shown on the next slide ] .debug[[k8s/ingress.md](https://github.com/BretFisher/kubernetes-mastery/tree/mastery/slides/k8s/ingress.md)] --- ## The Ingress resource .small[ ```yaml apiVersion: networking.k8s.io/v1beta1 kind: Ingress metadata: name: cheeseplate annotations: traefik.ingress.kubernetes.io/service-weights: | cheddar: 50% wensleydale: 25% stilton: 25% spec: rules: - host: cheeseplate.`A.B.C.D`.nip.io http: paths: - path: / backend: serviceName: cheddar servicePort: 80 - path: / backend: serviceName: wensledale servicePort: 80 - path: / backend: serviceName: stilton servicePort: 80 ``` ] .debug[[k8s/ingress.md](https://github.com/BretFisher/kubernetes-mastery/tree/mastery/slides/k8s/ingress.md)] --- ## Testing the canary - Let's check the percentage of requests going to each service .exercise[ - Continuously send HTTP requests to the new ingress: ```bash while sleep 0.1; do curl -s http://cheeseplate.A.B.C.D.nip.io/ done ``` ] We should see a 50/25/25 request mix. .debug[[k8s/ingress.md](https://github.com/BretFisher/kubernetes-mastery/tree/mastery/slides/k8s/ingress.md)] --- class: extra-details ## Load balancing fairness Note: if we use odd request ratios, the load balancing algorithm might appear to be broken on a small scale (when sending a small number of requests), but on a large scale (with many requests) it will be fair. For instance, with a 11%/89% ratio, we can see 79 requests going to the 89%-weighted service, and then requests alternating between the two services; then 79 requests again, etc. .debug[[k8s/ingress.md](https://github.com/BretFisher/kubernetes-mastery/tree/mastery/slides/k8s/ingress.md)] --- class: extra-details ## Other ingress controllers *Just to illustrate how different things are ...* - With the NGINX ingress controller: - define two ingress ressources <br/> (specifying rules with the same host+path) - add `nginx.ingress.kubernetes.io/canary` annotations on each - With Linkerd2: - define two services - define an extra service for the weighted aggregate of the two - define a TrafficSplit (this is a CRD introduced by the SMI spec) .debug[[k8s/ingress.md](https://github.com/BretFisher/kubernetes-mastery/tree/mastery/slides/k8s/ingress.md)] --- class: extra-details ## We need more than that What we saw is just one of the multiple building blocks that we need to achieve a canary release. We also need: - metrics (latency, performance ...) for our releases - automation to alter canary weights (increase canary weight if metrics look good; decrease otherwise) - a mechanism to manage the lifecycle of the canary releases (create them, promote them, delete them ...) For inspiration, check [flagger by Weave](https://github.com/weaveworks/flagger). .debug[[k8s/ingress.md](https://github.com/BretFisher/kubernetes-mastery/tree/mastery/slides/k8s/ingress.md)] --- class: pic .interstitial[] --- name: toc-kustomize class: title Kustomize .nav[ [Previous section](#toc-exposing-http-services-with-ingress-resources) | [Back to table of contents](#toc-chapter-7) | [Next section](#toc-managing-stacks-with-helm) ] .debug[(automatically generated title slide)] --- # Kustomize - Kustomize lets us transform YAML files representing Kubernetes resources - The original YAML files are valid resource files (e.g. they can be loaded with `kubectl apply -f`) - They are left untouched by Kustomize - Kustomize lets us define *overlays* that extend or change the resource files .debug[[k8s/kustomize.md](https://github.com/BretFisher/kubernetes-mastery/tree/mastery/slides/k8s/kustomize.md)] --- ## Differences with Helm - Helm charts use placeholders `{{ like.this }}` - Kustomize "bases" are standard Kubernetes YAML - It is possible to use an existing set of YAML as a Kustomize base - As a result, writing a Helm chart is more work ... - ... But Helm charts are also more powerful; e.g. they can: - use flags to conditionally include resources or blocks - check if a given Kubernetes API group is supported - [and much more](https://helm.sh/docs/chart_template_guide/) .debug[[k8s/kustomize.md](https://github.com/BretFisher/kubernetes-mastery/tree/mastery/slides/k8s/kustomize.md)] --- ## Kustomize concepts - Kustomize needs a `kustomization.yaml` file - That file can be a *base* or a *variant* - If it's a *base*: - it lists YAML resource files to use - If it's a *variant* (or *overlay*): - it refers to (at least) one *base* - and some *patches* .debug[[k8s/kustomize.md](https://github.com/BretFisher/kubernetes-mastery/tree/mastery/slides/k8s/kustomize.md)] --- ## An easy way to get started with Kustomize - We are going to use [Replicated Ship](https://www.replicated.com/ship/) to experiment with Kustomize - The [Replicated Ship CLI](https://github.com/replicatedhq/ship/releases) has been installed on our clusters - Replicated Ship has multiple workflows; here is what we will do: - initialize a Kustomize overlay from a remote GitHub repository - customize some values using the web UI provided by Ship - look at the resulting files and apply them to the cluster .debug[[k8s/kustomize.md](https://github.com/BretFisher/kubernetes-mastery/tree/mastery/slides/k8s/kustomize.md)] --- ## Getting started with Ship - We need to run `ship init` in a new directory - `ship init` requires a URL to a remote repository containing Kubernetes YAML - It will clone that repository and start a web UI - Later, it can watch that repository and/or update from it - We will use the [jpetazzo/kubercoins](https://github.com/jpetazzo/kubercoins) repository (it contains all the DockerCoins resources as YAML files) .debug[[k8s/kustomize.md](https://github.com/BretFisher/kubernetes-mastery/tree/mastery/slides/k8s/kustomize.md)] --- ## `ship init` .exercise[ - Change to a new directory: ```bash mkdir ~/kustomcoins cd ~/kustomcoins ``` - Run `ship init` with the kustomcoins repository: ```bash ship init https://github.com/jpetazzo/kubercoins ``` <!-- ```wait Open browser``` --> ] .debug[[k8s/kustomize.md](https://github.com/BretFisher/kubernetes-mastery/tree/mastery/slides/k8s/kustomize.md)] --- ## Access the web UI - `ship init` tells us to connect on `localhost:8800` - We need to replace `localhost` with the address of our node (since we run on a remote machine) - Follow the steps in the web UI, and change one parameter (e.g. set the number of replicas in the worker Deployment) - Complete the web workflow, and go back to the CLI .debug[[k8s/kustomize.md](https://github.com/BretFisher/kubernetes-mastery/tree/mastery/slides/k8s/kustomize.md)] --- ## Inspect the results - Look at the content of our directory - `base` contains the kubercoins repository + a `kustomization.yaml` file - `overlays/ship` contains the Kustomize overlay referencing the base + our patch(es) - `rendered.yaml` is a YAML bundle containing the patched application - `.ship` contains a state file used by Ship .debug[[k8s/kustomize.md](https://github.com/BretFisher/kubernetes-mastery/tree/mastery/slides/k8s/kustomize.md)] --- ## Using the results - We can `kubectl apply -f rendered.yaml` (on any version of Kubernetes) - Starting with Kubernetes 1.14, we can apply the overlay directly with: ```bash kubectl apply -k overlays/ship ``` - But let's not do that for now! - We will create a new copy of DockerCoins in another namespace .debug[[k8s/kustomize.md](https://github.com/BretFisher/kubernetes-mastery/tree/mastery/slides/k8s/kustomize.md)] --- ## Deploy DockerCoins with Kustomize .exercise[ - Create a new namespace: ```bash kubectl create namespace kustomcoins ``` - Deploy DockerCoins: ```bash kubectl apply -f rendered.yaml --namespace=kustomcoins ``` - Or, with Kubernetes 1.14, you can also do this: ```bash kubectl apply -k overlays/ship --namespace=kustomcoins ``` ] .debug[[k8s/kustomize.md](https://github.com/BretFisher/kubernetes-mastery/tree/mastery/slides/k8s/kustomize.md)] --- ## Checking our new copy of DockerCoins - We can check the worker logs, or the web UI .exercise[ - Retrieve the NodePort number of the web UI: ```bash kubectl get service webui --namespace=kustomcoins ``` - Open it in a web browser - Look at the worker logs: ```bash kubectl logs deploy/worker --tail=10 --follow --namespace=kustomcoins ``` <!-- ```wait units of work done``` ```key ^C``` --> ] Note: it might take a minute or two for the worker to start. .debug[[k8s/kustomize.md](https://github.com/BretFisher/kubernetes-mastery/tree/mastery/slides/k8s/kustomize.md)] --- class: pic .interstitial[] --- name: toc-managing-stacks-with-helm class: title Managing stacks with Helm .nav[ [Previous section](#toc-kustomize) | [Back to table of contents](#toc-chapter-7) | [Next section](#toc-helm-chart-format) ] .debug[(automatically generated title slide)] --- # Managing stacks with Helm - We created our first resources with `kubectl run`, `kubectl expose` ... - We have also created resources by loading YAML files with `kubectl apply -f` - For larger stacks, managing thousands of lines of YAML is unreasonable - These YAML bundles need to be customized with variable parameters (E.g.: number of replicas, image version to use ...) - It would be nice to have an organized, versioned collection of bundles - It would be nice to be able to upgrade/rollback these bundles carefully - [Helm](https://helm.sh/) is an open source project offering all these things! .debug[[k8s/helm-intro.md](https://github.com/BretFisher/kubernetes-mastery/tree/mastery/slides/k8s/helm-intro.md)] --- ## Helm concepts - `helm` is a CLI tool - It is used to find, install, upgrade *charts* - A chart is an archive containing templatized YAML bundles - Charts are versioned - Charts can be stored on private or public repositories .debug[[k8s/helm-intro.md](https://github.com/BretFisher/kubernetes-mastery/tree/mastery/slides/k8s/helm-intro.md)] --- ## Differences between charts and packages - A package (deb, rpm...) contains binaries, libraries, etc. - A chart contains YAML manifests (the binaries, libraries, etc. are in the images referenced by the chart) - On most distributions, a package can only be installed once (installing another version replaces the installed one) - A chart can be installed multiple times - Each installation is called a *release* - This allows to install e.g. 10 instances of MongoDB (with potentially different versions and configurations) .debug[[k8s/helm-intro.md](https://github.com/BretFisher/kubernetes-mastery/tree/mastery/slides/k8s/helm-intro.md)] --- class: extra-details ## Wait a minute ... *But, on my Debian system, I have Python 2 **and** Python 3. <br/> Also, I have multiple versions of the Postgres database engine!* Yes! But they have different package names: - `python2.7`, `python3.8` - `postgresql-10`, `postgresql-11` Good to know: the Postgres package in Debian includes provisions to deploy multiple Postgres servers on the same system, but it's an exception (and it's a lot of work done by the package maintainer, not by the `dpkg` or `apt` tools). .debug[[k8s/helm-intro.md](https://github.com/BretFisher/kubernetes-mastery/tree/mastery/slides/k8s/helm-intro.md)] --- ## Helm 2 vs Helm 3 - Helm 3 was released [November 13, 2019](https://helm.sh/blog/helm-3-released/) - Charts remain compatible between Helm 2 and Helm 3 - The CLI is very similar (with minor changes to some commands) - The main difference is that Helm 2 uses `tiller`, a server-side component - Helm 3 doesn't use `tiller` at all, making it simpler (yay!) .debug[[k8s/helm-intro.md](https://github.com/BretFisher/kubernetes-mastery/tree/mastery/slides/k8s/helm-intro.md)] --- class: extra-details ## With or without `tiller` - With Helm 3: - the `helm` CLI communicates directly with the Kubernetes API - it creates resources (deployments, services...) with our credentials - With Helm 2: - the `helm` CLI communicates with `tiller`, telling `tiller` what to do - `tiller` then communicates with the Kubernetes API, using its own credentials - This indirect model caused significant permissions headaches (`tiller` required very broad permissions to function) - `tiller` was removed in Helm 3 to simplify the security aspects .debug[[k8s/helm-intro.md](https://github.com/BretFisher/kubernetes-mastery/tree/mastery/slides/k8s/helm-intro.md)] --- ## Installing Helm - If the `helm` CLI is not installed in your environment, install it .exercise[ - Check if `helm` is installed: ```bash helm ``` - If it's not installed, run the following command: ```bash curl https://raw.githubusercontent.com/kubernetes/helm/master/scripts/get-helm-3 \ | bash ``` ] (To install Helm 2, replace `get-helm-3` with `get`.) .debug[[k8s/helm-intro.md](https://github.com/BretFisher/kubernetes-mastery/tree/mastery/slides/k8s/helm-intro.md)] --- class: extra-details ## Only if using Helm 2 ... - We need to install Tiller and give it some permissions - Tiller is composed of a *service* and a *deployment* in the `kube-system` namespace - They can be managed (installed, upgraded...) with the `helm` CLI .exercise[ - Deploy Tiller: ```bash helm init ``` ] At the end of the install process, you will see: ``` Happy Helming! ``` .debug[[k8s/helm-intro.md](https://github.com/BretFisher/kubernetes-mastery/tree/mastery/slides/k8s/helm-intro.md)] --- class: extra-details ## Only if using Helm 2 ... - Tiller needs permissions to create Kubernetes resources - In a more realistic deployment, you might create per-user or per-team service accounts, roles, and role bindings .exercise[ - Grant `cluster-admin` role to `kube-system:default` service account: ```bash kubectl create clusterrolebinding add-on-cluster-admin \ --clusterrole=cluster-admin --serviceaccount=kube-system:default ``` ] (Defining the exact roles and permissions on your cluster requires a deeper knowledge of Kubernetes' RBAC model. The command above is fine for personal and development clusters.) .debug[[k8s/helm-intro.md](https://github.com/BretFisher/kubernetes-mastery/tree/mastery/slides/k8s/helm-intro.md)] --- ## Charts and repositories - A *repository* (or repo in short) is a collection of charts - It's just a bunch of files (they can be hosted by a static HTTP server, or on a local directory) - We can add "repos" to Helm, giving them a nickname - The nickname is used when referring to charts on that repo (for instance, if we try to install `hello/world`, that means the chart `world` on the repo `hello`; and that repo `hello` might be something like https://blahblah.hello.io/charts/) .debug[[k8s/helm-intro.md](https://github.com/BretFisher/kubernetes-mastery/tree/mastery/slides/k8s/helm-intro.md)] --- ## Managing repositories - Let's check what repositories we have, and add the `stable` repo (the `stable` repo contains a set of official-ish charts) .exercise[ - List our repos: ```bash helm repo list ``` - Add the `stable` repo: ```bash helm repo add stable https://kubernetes-charts.storage.googleapis.com/ ``` ] Adding a repo can take a few seconds (it downloads the list of charts from the repo). It's OK to add a repo that already exists (it will merely update it). .debug[[k8s/helm-intro.md](https://github.com/BretFisher/kubernetes-mastery/tree/mastery/slides/k8s/helm-intro.md)] --- ## Search available charts - We can search available charts with `helm search` - We need to specify where to search (only our repos, or Helm Hub) - Let's search for all charts mentioning tomcat! .exercise[ - Search for tomcat in the repo that we added earlier: ```bash helm search repo tomcat ``` - Search for tomcat on the Helm Hub: ```bash helm search hub tomcat ``` ] [Helm Hub](https://hub.helm.sh/) indexes many repos, using the [Monocular](https://github.com/helm/monocular) server. .debug[[k8s/helm-intro.md](https://github.com/BretFisher/kubernetes-mastery/tree/mastery/slides/k8s/helm-intro.md)] --- ## Charts and releases - "Installing a chart" means creating a *release* - We need to name that release (or use the `--generate-name` to get Helm to generate one for us) .exercise[ - Install the tomcat chart that we found earlier: ```bash helm install java4ever stable/tomcat ``` - List the releases: ```bash helm list ``` ] .debug[[k8s/helm-intro.md](https://github.com/BretFisher/kubernetes-mastery/tree/mastery/slides/k8s/helm-intro.md)] --- class: extra-details ## Searching and installing with Helm 2 - Helm 2 doesn't have support for the Helm Hub - The `helm search` command only takes a search string argument (e.g. `helm search tomcat`) - With Helm 2, the name is optional: `helm install stable/tomcat` will automatically generate a name `helm install --name java4ever stable/tomcat` will specify a name .debug[[k8s/helm-intro.md](https://github.com/BretFisher/kubernetes-mastery/tree/mastery/slides/k8s/helm-intro.md)] --- ## Viewing resources of a release - This specific chart labels all its resources with a `release` label - We can use a selector to see these resources .exercise[ - List all the resources created by this release: ```bash kubectl get all --selector=release=java4ever ``` ] Note: this `release` label wasn't added automatically by Helm. <br/> It is defined in that chart. In other words, not all charts will provide this label. .debug[[k8s/helm-intro.md](https://github.com/BretFisher/kubernetes-mastery/tree/mastery/slides/k8s/helm-intro.md)] --- ## Configuring a release - By default, `stable/tomcat` creates a service of type `LoadBalancer` - We would like to change that to a `NodePort` - We could use `kubectl edit service java4ever-tomcat`, but ... ... our changes would get overwritten next time we update that chart! - Instead, we are going to *set a value* - Values are parameters that the chart can use to change its behavior - Values have default values - Each chart is free to define its own values and their defaults .debug[[k8s/helm-intro.md](https://github.com/BretFisher/kubernetes-mastery/tree/mastery/slides/k8s/helm-intro.md)] --- ## Checking possible values - We can inspect a chart with `helm show` or `helm inspect` .exercise[ - Look at the README for tomcat: ```bash helm show readme stable/tomcat ``` - Look at the values and their defaults: ```bash helm show values stable/tomcat ``` ] The `values` may or may not have useful comments. The `readme` may or may not have (accurate) explanations for the values. (If we're unlucky, there won't be any indication about how to use the values!) .debug[[k8s/helm-intro.md](https://github.com/BretFisher/kubernetes-mastery/tree/mastery/slides/k8s/helm-intro.md)] --- ## Setting values - Values can be set when installing a chart, or when upgrading it - We are going to update `java4ever` to change the type of the service .exercise[ - Update `java4ever`: ```bash helm upgrade java4ever stable/tomcat --set service.type=NodePort ``` ] Note that we have to specify the chart that we use (`stable/tomcat`), even if we just want to update some values. We can set multiple values. If we want to set many values, we can use `-f`/`--values` and pass a YAML file with all the values. All unspecified values will take the default values defined in the chart. .debug[[k8s/helm-intro.md](https://github.com/BretFisher/kubernetes-mastery/tree/mastery/slides/k8s/helm-intro.md)] --- ## Connecting to tomcat - Let's check the tomcat server that we just installed - Note: its readiness probe has a 60s delay (so it will take 60s after the initial deployment before the service works) .exercise[ - Check the node port allocated to the service: ```bash kubectl get service java4ever-tomcat PORT=$(kubectl get service java4ever-tomcat -o jsonpath={..nodePort}) ``` - Connect to it, checking the demo app on `/sample/`: ```bash curl localhost:$PORT/sample/ ``` ] .debug[[k8s/helm-intro.md](https://github.com/BretFisher/kubernetes-mastery/tree/mastery/slides/k8s/helm-intro.md)] --- class: pic .interstitial[] --- name: toc-helm-chart-format class: title Helm chart format .nav[ [Previous section](#toc-managing-stacks-with-helm) | [Back to table of contents](#toc-chapter-7) | [Next section](#toc-creating-a-basic-chart) ] .debug[(automatically generated title slide)] --- # Helm chart format - What exactly is a chart? - What's in it? - What would be involved in creating a chart? (we won't create a chart, but we'll see the required steps) .debug[[k8s/helm-chart-format.md](https://github.com/BretFisher/kubernetes-mastery/tree/mastery/slides/k8s/helm-chart-format.md)] --- ## What is a chart - A chart is a set of files - Some of these files are mandatory for the chart to be viable (more on that later) - These files are typically packed in a tarball - These tarballs are stored in "repos" (which can be static HTTP servers) - We can install from a repo, from a local tarball, or an unpacked tarball (the latter option is preferred when developing a chart) .debug[[k8s/helm-chart-format.md](https://github.com/BretFisher/kubernetes-mastery/tree/mastery/slides/k8s/helm-chart-format.md)] --- ## What's in a chart - A chart must have at least: - a `templates` directory, with YAML manifests for Kubernetes resources - a `values.yaml` file, containing (tunable) parameters for the chart - a `Chart.yaml` file, containing metadata (name, version, description ...) - Let's look at a simple chart, `stable/tomcat` .debug[[k8s/helm-chart-format.md](https://github.com/BretFisher/kubernetes-mastery/tree/mastery/slides/k8s/helm-chart-format.md)] --- ## Downloading a chart - We can use `helm pull` to download a chart from a repo .exercise[ - Download the tarball for `stable/tomcat`: ```bash helm pull stable/tomcat ``` (This will create a file named `tomcat-X.Y.Z.tgz`.) - Or, download + untar `stable/tomcat`: ```bash helm pull stable/tomcat --untar ``` (This will create a directory named `tomcat`.) ] .debug[[k8s/helm-chart-format.md](https://github.com/BretFisher/kubernetes-mastery/tree/mastery/slides/k8s/helm-chart-format.md)] --- ## Looking at the chart's content - Let's look at the files and directories in the `tomcat` chart .exercise[ - Display the tree structure of the chart we just downloaded: ```bash tree tomcat ``` ] We see the components mentioned above: `Chart.yaml`, `templates/`, `values.yaml`. .debug[[k8s/helm-chart-format.md](https://github.com/BretFisher/kubernetes-mastery/tree/mastery/slides/k8s/helm-chart-format.md)] --- ## Templates - The `templates/` directory contains YAML manifests for Kubernetes resources (Deployments, Services, etc.) - These manifests can contain template tags (using the standard Go template library) .exercise[ - Look at the template file for the tomcat Service resource: ```bash cat tomcat/templates/appsrv-svc.yaml ``` ] .debug[[k8s/helm-chart-format.md](https://github.com/BretFisher/kubernetes-mastery/tree/mastery/slides/k8s/helm-chart-format.md)] --- ## Analyzing the template file - Tags are identified by `{{ ... }}` - `{{ template "x.y" }}` expands a [named template](https://helm.sh/docs/chart_template_guide/named_templates/#declaring-and-using-templates-with-define-and-template) (previously defined with `{{ define "x.y "}}...stuff...{{ end }}`) - The `.` in `{{ template "x.y" . }}` is the *context* for that named template (so that the named template block can access variables from the local context) - `{{ .Release.xyz }}` refers to [built-in variables](https://helm.sh/docs/chart_template_guide/builtin_objects/) initialized by Helm (indicating the chart name, version, whether we are installing or upgrading ...) - `{{ .Values.xyz }}` refers to tunable/settable [values](https://helm.sh/docs/chart_template_guide/values_files/) (more on that in a minute) .debug[[k8s/helm-chart-format.md](https://github.com/BretFisher/kubernetes-mastery/tree/mastery/slides/k8s/helm-chart-format.md)] --- ## Values - Each chart comes with a [values file](https://helm.sh/docs/chart_template_guide/values_files/) - It's a YAML file containing a set of default parameters for the chart - The values can be accessed in templates with e.g. `{{ .Values.x.y }}` (corresponding to field `y` in map `x` in the values file) - The values can be set or overridden when installing or ugprading a chart: - with `--set x.y=z` (can be used multiple times to set multiple values) - with `--values some-yaml-file.yaml` (set a bunch of values from a file) - Charts following best practices will have values following specific patterns (e.g. having a `service` map allowing to set `service.type` etc.) .debug[[k8s/helm-chart-format.md](https://github.com/BretFisher/kubernetes-mastery/tree/mastery/slides/k8s/helm-chart-format.md)] --- ## Other useful tags - `{{ if x }} y {{ end }}` allows to include `y` if `x` evaluates to `true` (can be used for e.g. healthchecks, annotations, or even an entire resource) - `{{ range x }} y {{ end }}` iterates over `x`, evaluating `y` each time (the elements of `x` are assigned to `.` in the range scope) - `{{- x }}`/`{{ x -}}` will remove whitespace on the left/right - The whole [Sprig](http://masterminds.github.io/sprig/) library, with additions: `lower` `upper` `quote` `trim` `default` `b64enc` `b64dec` `sha256sum` `indent` `toYaml` ... .debug[[k8s/helm-chart-format.md](https://github.com/BretFisher/kubernetes-mastery/tree/mastery/slides/k8s/helm-chart-format.md)] --- ## Pipelines - `{{ quote blah }}` can also be expressed as `{{ blah | quote }}` - With multiple arguments, `{{ x y z }}` can be expressed as `{{ z | x y }}`) - Example: `{{ .Values.annotations | toYaml | indent 4 }}` - transforms the map under `annotations` into a YAML string - indents it with 4 spaces (to match the surrounding context) - Pipelines are not specific to Helm, but a feature of Go templates (check the [Go text/template documentation](https://golang.org/pkg/text/template/) for more details and examples) .debug[[k8s/helm-chart-format.md](https://github.com/BretFisher/kubernetes-mastery/tree/mastery/slides/k8s/helm-chart-format.md)] --- ## README and NOTES.txt - At the top-level of the chart, it's a good idea to have a README - It will be viewable with e.g. `helm show readme stable/tomcat` - In the `templates/` directory, we can also have a `NOTES.txt` file - When the template is installed (or upgraded), `NOTES.txt` is processed too (i.e. its `{{ ... }}` tags are evaluated) - It gets displayed after the install or upgrade - It's a great place to generate messages to tell the user: - how to connect to the release they just deployed - any passwords or other thing that we generated for them .debug[[k8s/helm-chart-format.md](https://github.com/BretFisher/kubernetes-mastery/tree/mastery/slides/k8s/helm-chart-format.md)] --- ## Additional files - We can place arbitrary files in the chart (outside of the `templates/` directory) - They can be accessed in templates with `.Files` - They can be transformed into ConfigMaps or Secrets with `AsConfig` and `AsSecrets` (see [this example](https://helm.sh/docs/chart_template_guide/accessing_files/#configmap-and-secrets-utility-functions) in the Helm docs) .debug[[k8s/helm-chart-format.md](https://github.com/BretFisher/kubernetes-mastery/tree/mastery/slides/k8s/helm-chart-format.md)] --- ## Hooks and tests - We can define *hooks* in our templates - Hooks are resources annotated with `"helm.sh/hook": NAME-OF-HOOK` - Hook names include `pre-install`, `post-install`, `test`, [and much more](https://helm.sh/docs/topics/charts_hooks/#the-available-hooks) - The resources defined in hooks are loaded at a specific time - Hook execution is *synchronous* (if the resource is a Job or Pod, Helm will wait for its completion) - This can be use for database migrations, backups, notifications, smoke tests ... - Hooks named `test` are executed only when running `helm test RELEASE-NAME` .debug[[k8s/helm-chart-format.md](https://github.com/BretFisher/kubernetes-mastery/tree/mastery/slides/k8s/helm-chart-format.md)] --- class: pic .interstitial[] --- name: toc-creating-a-basic-chart class: title Creating a basic chart .nav[ [Previous section](#toc-helm-chart-format) | [Back to table of contents](#toc-chapter-7) | [Next section](#toc-creating-better-helm-charts) ] .debug[(automatically generated title slide)] --- # Creating a basic chart - We are going to show a way to create a *very simplified* chart - In a real chart, *lots of things* would be templatized (Resource names, service types, number of replicas...) .exercise[ - Create a sample chart: ```bash helm create dockercoins ``` - Move away the sample templates and create an empty template directory: ```bash mv dockercoins/templates dockercoins/default-templates mkdir dockercoins/templates ``` ] .debug[[k8s/helm-create-basic-chart.md](https://github.com/BretFisher/kubernetes-mastery/tree/mastery/slides/k8s/helm-create-basic-chart.md)] --- ## Exporting the YAML for our application - The following section assumes that DockerCoins is currently running - If DockerCoins is not running, see next slide .exercise[ - Create one YAML file for each resource that we need: .small[ ```bash while read kind name; do kubectl get -o yaml $kind $name > dockercoins/templates/$name-$kind.yaml done <<EOF deployment worker deployment hasher daemonset rng deployment webui deployment redis service hasher service rng service webui service redis EOF ``` ] ] .debug[[k8s/helm-create-basic-chart.md](https://github.com/BretFisher/kubernetes-mastery/tree/mastery/slides/k8s/helm-create-basic-chart.md)] --- ## Obtaining DockerCoins YAML - If DockerCoins is not running, we can also obtain the YAML from a public repository .exercise[ - Clone the kubercoins repository: ```bash git clone https://github.com/jpetazzo/kubercoins ``` - Copy the YAML files to the `templates/` directory: ```bash cp kubercoins/*.yaml dockercoins/templates/ ``` ] .debug[[k8s/helm-create-basic-chart.md](https://github.com/BretFisher/kubernetes-mastery/tree/mastery/slides/k8s/helm-create-basic-chart.md)] --- ## Testing our helm chart .exercise[ - Let's install our helm chart! ``` helm install helmcoins dockercoins ``` (`helmcoins` is the name of the release; `dockercoins` is the local path of the chart) ] -- - Since the application is already deployed, this will fail: ``` Error: rendered manifests contain a resource that already exists. Unable to continue with install: existing resource conflict: kind: Service, namespace: default, name: hasher ``` - To avoid naming conflicts, we will deploy the application in another *namespace* .debug[[k8s/helm-create-basic-chart.md](https://github.com/BretFisher/kubernetes-mastery/tree/mastery/slides/k8s/helm-create-basic-chart.md)] --- ## Switching to another namespace - We need create a new namespace (Helm 2 creates namespaces automatically; Helm 3 doesn't anymore) - We need to tell Helm which namespace to use .exercise[ - Create a new namespace: ```bash kubectl create namespace helmcoins ``` - Deploy our chart in that namespace: ```bash helm install helmcoins dockercoins --namespace=helmcoins ``` ] .debug[[k8s/helm-create-basic-chart.md](https://github.com/BretFisher/kubernetes-mastery/tree/mastery/slides/k8s/helm-create-basic-chart.md)] --- ## Helm releases are namespaced - Let's try to see the release that we just deployed .exercise[ - List Helm releases: ```bash helm list ``` ] Our release doesn't show up! We have to specify its namespace (or switch to that namespace). .debug[[k8s/helm-create-basic-chart.md](https://github.com/BretFisher/kubernetes-mastery/tree/mastery/slides/k8s/helm-create-basic-chart.md)] --- ## Specifying the namespace - Try again, with the correct namespace .exercise[ - List Helm releases in `helmcoins`: ```bash helm list --namespace=helmcoins ``` ] .debug[[k8s/helm-create-basic-chart.md](https://github.com/BretFisher/kubernetes-mastery/tree/mastery/slides/k8s/helm-create-basic-chart.md)] --- ## Checking our new copy of DockerCoins - We can check the worker logs, or the web UI .exercise[ - Retrieve the NodePort number of the web UI: ```bash kubectl get service webui --namespace=helmcoins ``` - Open it in a web browser - Look at the worker logs: ```bash kubectl logs deploy/worker --tail=10 --follow --namespace=helmcoins ``` ] Note: it might take a minute or two for the worker to start. .debug[[k8s/helm-create-basic-chart.md](https://github.com/BretFisher/kubernetes-mastery/tree/mastery/slides/k8s/helm-create-basic-chart.md)] --- ## Discussion, shortcomings - Helm (and Kubernetes) best practices recommend to add a number of annotations (e.g. `app.kubernetes.io/name`, `helm.sh/chart`, `app.kubernetes.io/instance` ...) - Our basic chart doesn't have any of these - Our basic chart doesn't use any template tag - Does it make sense to use Helm in that case? - *Yes,* because Helm will: - track the resources created by the chart - save successive revisions, allowing us to rollback [Helm docs](https://helm.sh/docs/topics/chart_best_practices/labels/) and [Kubernetes docs](https://kubernetes.io/docs/concepts/overview/working-with-objects/common-labels/) have details about recommended annotations and labels. .debug[[k8s/helm-create-basic-chart.md](https://github.com/BretFisher/kubernetes-mastery/tree/mastery/slides/k8s/helm-create-basic-chart.md)] --- ## Cleaning up - Let's remove that chart before moving on .exercise[ - Delete the release (don't forget to specify the namespace): ```bash helm delete helmcoins --namespace=helmcoins ``` ] .debug[[k8s/helm-create-basic-chart.md](https://github.com/BretFisher/kubernetes-mastery/tree/mastery/slides/k8s/helm-create-basic-chart.md)] --- class: pic .interstitial[] --- name: toc-creating-better-helm-charts class: title Creating better Helm charts .nav[ [Previous section](#toc-creating-a-basic-chart) | [Back to table of contents](#toc-chapter-7) | [Next section](#toc-helm-secrets) ] .debug[(automatically generated title slide)] --- # Creating better Helm charts - We are going to create a chart with the helper `helm create` - This will give us a chart implementing lots of Helm best practices (labels, annotations, structure of the `values.yaml` file ...) - We will use that chart as a generic Helm chart - We will use it to deploy DockerCoins - Each component of DockerCoins will have its own *release* - In other words, we will "install" that Helm chart multiple times (one time per component of DockerCoins) .debug[[k8s/helm-create-better-chart.md](https://github.com/BretFisher/kubernetes-mastery/tree/mastery/slides/k8s/helm-create-better-chart.md)] --- ## Creating a generic chart - Rather than starting from scratch, we will use `helm create` - This will give us a basic chart that we will customize .exercise[ - Create a basic chart: ```bash cd ~ helm create helmcoins ``` ] This creates a basic chart in the directory `helmcoins`. .debug[[k8s/helm-create-better-chart.md](https://github.com/BretFisher/kubernetes-mastery/tree/mastery/slides/k8s/helm-create-better-chart.md)] --- ## What's in the basic chart? - The basic chart will create a Deployment and a Service - Optionally, it will also include an Ingress - If we don't pass any values, it will deploy the `nginx` image - We can override many things in that chart - Let's try to deploy DockerCoins components with that chart! .debug[[k8s/helm-create-better-chart.md](https://github.com/BretFisher/kubernetes-mastery/tree/mastery/slides/k8s/helm-create-better-chart.md)] --- ## Writing `values.yaml` for our components - We need to write one `values.yaml` file for each component (hasher, redis, rng, webui, worker) - We will start with the `values.yaml` of the chart, and remove what we don't need - We will create 5 files: hasher.yaml, redis.yaml, rng.yaml, webui.yaml, worker.yaml - In each file, we want to have: ```yaml image: repository: IMAGE-REPOSITORY-NAME tag: IMAGE-TAG ``` .debug[[k8s/helm-create-better-chart.md](https://github.com/BretFisher/kubernetes-mastery/tree/mastery/slides/k8s/helm-create-better-chart.md)] --- ## Getting started - For component X, we want to use the image dockercoins/X:v0.1 (for instance, for rng, we want to use the image dockercoins/rng:v0.1) - Exception: for redis, we want to use the official image redis:latest .exercise[ - Write YAML files for the 5 components, with the following model: ```yaml image: repository: `IMAGE-REPOSITORY-NAME` (e.g. dockercoins/worker) tag: `IMAGE-TAG` (e.g. v0.1) ``` ] .debug[[k8s/helm-create-better-chart.md](https://github.com/BretFisher/kubernetes-mastery/tree/mastery/slides/k8s/helm-create-better-chart.md)] --- ## Deploying DockerCoins components - For convenience, let's work in a separate namespace .exercise[ - Create a new namespace (if it doesn't already exist): ```bash kubectl create namespace helmcoins ``` - Switch to that namespace: ```bash kns helmcoins ``` ] .debug[[k8s/helm-create-better-chart.md](https://github.com/BretFisher/kubernetes-mastery/tree/mastery/slides/k8s/helm-create-better-chart.md)] --- ## Deploying the chart - To install a chart, we can use the following command: ```bash helm install COMPONENT-NAME CHART-DIRECTORY ``` - We can also use the following command, which is idempotent: ```bash helm upgrade COMPONENT-NAME CHART-DIRECTORY --install ``` .exercise[ - Install the 5 components of DockerCoins: ```bash for COMPONENT in hasher redis rng webui worker; do helm upgrade $COMPONENT helmcoins --install --values=$COMPONENT.yaml done ``` ] .debug[[k8s/helm-create-better-chart.md](https://github.com/BretFisher/kubernetes-mastery/tree/mastery/slides/k8s/helm-create-better-chart.md)] --- ## Checking what we've done - Let's see if DockerCoins is working! .exercise[ - Check the logs of the worker: ```bash stern worker ``` - Look at the resources that were created: ```bash kubectl get all ``` ] There are *many* issues to fix! .debug[[k8s/helm-create-better-chart.md](https://github.com/BretFisher/kubernetes-mastery/tree/mastery/slides/k8s/helm-create-better-chart.md)] --- ## Can't pull image - It looks like our images can't be found .exercise[ - Use `kubectl describe` on any of the pods in error ] - We're trying to pull `rng:1.16.0` instead of `rng:v0.1`! - Where does that `1.16.0` tag come from? .debug[[k8s/helm-create-better-chart.md](https://github.com/BretFisher/kubernetes-mastery/tree/mastery/slides/k8s/helm-create-better-chart.md)] --- ## Inspecting our template - Let's look at the `templates/` directory (and try to find the one generating the Deployment resource) .exercise[ - Show the structure of the `helmcoins` chart that Helm generated: ```bash tree helmcoins ``` - Check the file `helmcoins/templates/deployment.yaml` - Look for the `image:` parameter ] *The image tag references `{{ .Chart.AppVersion }}`. Where does that come from?* .debug[[k8s/helm-create-better-chart.md](https://github.com/BretFisher/kubernetes-mastery/tree/mastery/slides/k8s/helm-create-better-chart.md)] --- ## The `.Chart` variable - `.Chart` is a map corresponding to the values in `Chart.yaml` - Let's look for `AppVersion` there! .exercise[ - Check the file `helmcoins/Chart.yaml` - Look for the `appVersion:` parameter ] (Yes, the case is different between the template and the Chart file.) .debug[[k8s/helm-create-better-chart.md](https://github.com/BretFisher/kubernetes-mastery/tree/mastery/slides/k8s/helm-create-better-chart.md)] --- ## Using the correct tags - If we change `AppVersion` to `v0.1`, it will change for *all* deployments (including redis) - Instead, let's change the *template* to use `{{ .Values.image.tag }}` (to match what we've specified in our values YAML files) .exercise[ - Edit `helmcoins/templates/deployment.yaml` - Replace `{{ .Chart.AppVersion }}` with `{{ .Values.image.tag }}` ] .debug[[k8s/helm-create-better-chart.md](https://github.com/BretFisher/kubernetes-mastery/tree/mastery/slides/k8s/helm-create-better-chart.md)] --- ## Upgrading to use the new template - Technically, we just made a new version of the *chart* - To use the new template, we need to *upgrade* the release to use that chart .exercise[ - Upgrade all components: ```bash for COMPONENT in hasher redis rng webui worker; do helm upgrade $COMPONENT helmcoins done ``` - Check how our pods are doing: ```bash kubectl get pods ``` ] We should see all pods "Running". But ... not all of them are READY. .debug[[k8s/helm-create-better-chart.md](https://github.com/BretFisher/kubernetes-mastery/tree/mastery/slides/k8s/helm-create-better-chart.md)] --- ## Troubleshooting readiness - `hasher`, `rng`, `webui` should show up as `1/1 READY` - But `redis` and `worker` should show up as `0/1 READY` - Why? .debug[[k8s/helm-create-better-chart.md](https://github.com/BretFisher/kubernetes-mastery/tree/mastery/slides/k8s/helm-create-better-chart.md)] --- ## Troubleshooting pods - The easiest way to troubleshoot pods is to look at *events* - We can look at all the events on the cluster (with `kubectl get events`) - Or we can use `kubectl describe` on the objects that have problems (`kubectl describe` will retrieve the events related to the object) .exercise[ - Check the events for the redis pods: ```bash kubectl describe pod -l app.kubernetes.io/name=redis ``` ] It's failing both its liveness and readiness probes! .debug[[k8s/helm-create-better-chart.md](https://github.com/BretFisher/kubernetes-mastery/tree/mastery/slides/k8s/helm-create-better-chart.md)] --- ## Healthchecks - The default chart defines healthchecks doing HTTP requests on port 80 - That won't work for redis and worker (redis is not HTTP, and not on port 80; worker doesn't even listen) -- - We could remove or comment out the healthchecks - We could also make them conditional - This sounds more interesting, let's do that! .debug[[k8s/helm-create-better-chart.md](https://github.com/BretFisher/kubernetes-mastery/tree/mastery/slides/k8s/helm-create-better-chart.md)] --- ## Conditionals - We need to enclose the healthcheck block with: `{{ if false }}` at the beginning (we can change the condition later) `{{ end }}` at the end .exercise[ - Edit `helmcoins/templates/deployment.yaml` - Add `{{ if false }}` on the line before `livenessProbe` - Add `{{ end }}` after the `readinessProbe` section (see next slide for details) ] .debug[[k8s/helm-create-better-chart.md](https://github.com/BretFisher/kubernetes-mastery/tree/mastery/slides/k8s/helm-create-better-chart.md)] --- This is what the new YAML should look like (added lines in yellow): ```yaml ports: - name: http containerPort: 80 protocol: TCP `{{ if false }}` livenessProbe: httpGet: path: / port: http readinessProbe: httpGet: path: / port: http `{{ end }}` resources: {{- toYaml .Values.resources | nindent 12 }} ``` .debug[[k8s/helm-create-better-chart.md](https://github.com/BretFisher/kubernetes-mastery/tree/mastery/slides/k8s/helm-create-better-chart.md)] --- ## Testing the new chart - We need to upgrade all the services again to use the new chart .exercise[ - Upgrade all components: ```bash for COMPONENT in hasher redis rng webui worker; do helm upgrade $COMPONENT helmcoins done ``` - Check how our pods are doing: ```bash kubectl get pods ``` ] Everything should now be running! .debug[[k8s/helm-create-better-chart.md](https://github.com/BretFisher/kubernetes-mastery/tree/mastery/slides/k8s/helm-create-better-chart.md)] --- ## What's next? - Is this working now? .exercise[ - Let's check the logs of the worker: ```bash stern worker ``` ] This error might look familiar ... The worker can't resolve `redis`. Typically, that error means that the `redis` service doesn't exist. .debug[[k8s/helm-create-better-chart.md](https://github.com/BretFisher/kubernetes-mastery/tree/mastery/slides/k8s/helm-create-better-chart.md)] --- ## Checking services - What about the services created by our chart? .exercise[ - Check the list of services: ```bash kubectl get services ``` ] They are named `COMPONENT-helmcoins` instead of just `COMPONENT`. We need to change that! .debug[[k8s/helm-create-better-chart.md](https://github.com/BretFisher/kubernetes-mastery/tree/mastery/slides/k8s/helm-create-better-chart.md)] --- ## Where do the service names come from? - Look at the YAML template used for the services - It should be using `{{ include "helmcoins.fullname" }}` - `include` indicates a *template block* defined somewhere else .exercise[ - Find where that `fullname` thing is defined: ```bash grep define.*fullname helmcoins/templates/* ``` ] It should be in `_helpers.tpl`. We can look at the definition, but it's fairly complex ... .debug[[k8s/helm-create-better-chart.md](https://github.com/BretFisher/kubernetes-mastery/tree/mastery/slides/k8s/helm-create-better-chart.md)] --- ## Changing service names - Instead of that `{{ include }}` tag, let's use the name of the release - The name of the release is available as `{{ .Release.Name }}` .exercise[ - Edit `helmcoins/templates/service.yaml` - Replace the service name with `{{ .Release.Name }}` - Upgrade all the releases to use the new chart - Confirm that the services now have the right names ] .debug[[k8s/helm-create-better-chart.md](https://github.com/BretFisher/kubernetes-mastery/tree/mastery/slides/k8s/helm-create-better-chart.md)] --- ## Is it working now? - If we look at the worker logs, it appears that the worker is still stuck - What could be happening? -- - The redis service is not on port 80! - Let's see how the port number is set - We need to look at both the *deployment* template and the *service* template .debug[[k8s/helm-create-better-chart.md](https://github.com/BretFisher/kubernetes-mastery/tree/mastery/slides/k8s/helm-create-better-chart.md)] --- ## Service template - In the service template, we have the following section: ```yaml ports: - port: {{ .Values.service.port }} targetPort: http protocol: TCP name: http ``` - `port` is the port on which the service is "listening" (i.e. to which our code needs to connect) - `targetPort` is the port on which the pods are listening - The `name` is not important (it's OK if it's `http` even for non-HTTP traffic) .debug[[k8s/helm-create-better-chart.md](https://github.com/BretFisher/kubernetes-mastery/tree/mastery/slides/k8s/helm-create-better-chart.md)] --- ## Setting the redis port - Let's add a `service.port` value to the redis release .exercise[ - Edit `redis.yaml` to add: ```yaml service: port: 6379 ``` - Apply the new values file: ```bash helm upgrade redis helmcoins --values=redis.yaml ``` ] .debug[[k8s/helm-create-better-chart.md](https://github.com/BretFisher/kubernetes-mastery/tree/mastery/slides/k8s/helm-create-better-chart.md)] --- ## Deployment template - If we look at the deployment template, we see this section: ```yaml ports: - name: http containerPort: 80 protocol: TCP ``` - The container port is hard-coded to 80 - We'll change it to use the port number specified in the values .debug[[k8s/helm-create-better-chart.md](https://github.com/BretFisher/kubernetes-mastery/tree/mastery/slides/k8s/helm-create-better-chart.md)] --- ## Changing the deployment template .exercise[ - Edit `helmcoins/templates/deployment.yaml` - The line with `containerPort` should be: ```yaml containerPort: {{ .Values.service.port }} ``` ] .debug[[k8s/helm-create-better-chart.md](https://github.com/BretFisher/kubernetes-mastery/tree/mastery/slides/k8s/helm-create-better-chart.md)] --- ## Apply changes - Re-run the for loop to execute `helm upgrade` one more time - Check the worker logs - This time, it should be working! .debug[[k8s/helm-create-better-chart.md](https://github.com/BretFisher/kubernetes-mastery/tree/mastery/slides/k8s/helm-create-better-chart.md)] --- ## Extra steps - We don't need to create a service for the worker - We can put the whole service block in a conditional (this will require additional changes in other files referencing the service) - We can set the webui to be a NodePort service - We can change the number of workers with `replicaCount` - And much more! .debug[[k8s/helm-create-better-chart.md](https://github.com/BretFisher/kubernetes-mastery/tree/mastery/slides/k8s/helm-create-better-chart.md)] --- class: pic .interstitial[] --- name: toc-helm-secrets class: title Helm secrets .nav[ [Previous section](#toc-creating-better-helm-charts) | [Back to table of contents](#toc-chapter-7) | [Next section](#toc-network-policies) ] .debug[(automatically generated title slide)] --- # Helm secrets - Helm can do *rollbacks*: - to previously installed charts - to previous sets of values - How and where does it store the data needed to do that? - Let's investigate! .debug[[k8s/helm-secrets.md](https://github.com/BretFisher/kubernetes-mastery/tree/mastery/slides/k8s/helm-secrets.md)] --- ## We need a release - We need to install something with Helm - Let's use the `stable/tomcat` chart as an example .exercise[ - Install a release called `tomcat` with the chart `stable/tomcat`: ```bash helm upgrade tomcat stable/tomcat --install ``` - Let's upgrade that release, and change a value: ```bash helm upgrade tomcat stable/tomcat --set ingress.enabled=true ``` ] .debug[[k8s/helm-secrets.md](https://github.com/BretFisher/kubernetes-mastery/tree/mastery/slides/k8s/helm-secrets.md)] --- ## Release history - Helm stores successive revisions of each release .exercise[ - View the history for that release: ```bash helm history tomcat ``` ] Where does that come from? .debug[[k8s/helm-secrets.md](https://github.com/BretFisher/kubernetes-mastery/tree/mastery/slides/k8s/helm-secrets.md)] --- ## Investigate - Possible options: - local filesystem (no, because history is visible from other machines) - persistent volumes (no, Helm works even without them) - ConfigMaps, Secrets? .exercise[ - Look for ConfigMaps and Secrets: ```bash kubectl get configmaps,secrets ``` ] -- We should see a number of secrets with TYPE `helm.sh/release.v1`. .debug[[k8s/helm-secrets.md](https://github.com/BretFisher/kubernetes-mastery/tree/mastery/slides/k8s/helm-secrets.md)] --- ## Unpacking a secret - Let's find out what is in these Helm secrets .exercise[ - Examine the secret corresponding to the second release of `tomcat`: ```bash kubectl describe secret sh.helm.release.v1.tomcat.v2 ``` (`v1` is the secret format; `v2` means revision 2 of the `tomcat` release) ] There is a key named `release`. .debug[[k8s/helm-secrets.md](https://github.com/BretFisher/kubernetes-mastery/tree/mastery/slides/k8s/helm-secrets.md)] --- ## Unpacking the release data - Let's see what's in this `release` thing! .exercise[ - Dump the secret: ```bash kubectl get secret sh.helm.release.v1.tomcat.v2 \ -o go-template='{{ .data.release }}' ``` ] Secrets are encoded in base64. We need to decode that! .debug[[k8s/helm-secrets.md](https://github.com/BretFisher/kubernetes-mastery/tree/mastery/slides/k8s/helm-secrets.md)] --- ## Decoding base64 - We can pipe the output through `base64 -d` or use go-template's `base64decode` .exercise[ - Decode the secret: ```bash kubectl get secret sh.helm.release.v1.tomcat.v2 \ -o go-template='{{ .data.release | base64decode }}' ``` ] -- ... Wait, this *still* looks like base64. What's going on? -- Let's try one more round of decoding! .debug[[k8s/helm-secrets.md](https://github.com/BretFisher/kubernetes-mastery/tree/mastery/slides/k8s/helm-secrets.md)] --- ## Decoding harder - Just add one more base64 decode filter .exercise[ - Decode it twice: ```bash kubectl get secret sh.helm.release.v1.tomcat.v2 \ -o go-template='{{ .data.release | base64decode | base64decode }}' ``` ] -- ... OK, that was *a lot* of binary data. What sould we do with it? .debug[[k8s/helm-secrets.md](https://github.com/BretFisher/kubernetes-mastery/tree/mastery/slides/k8s/helm-secrets.md)] --- ## Guessing data type - We could use `file` to figure out the data type .exercise[ - Pipe the decoded release through `file -`: ```bash kubectl get secret sh.helm.release.v1.tomcat.v2 \ -o go-template='{{ .data.release | base64decode | base64decode }}' \ | file - ``` ] -- Gzipped data! It can be decoded with `gunzip -c`. .debug[[k8s/helm-secrets.md](https://github.com/BretFisher/kubernetes-mastery/tree/mastery/slides/k8s/helm-secrets.md)] --- ## Uncompressing the data - Let's uncompress the data and save it to a file .exercise[ - Rerun the previous command, but with `| gunzip -c > release-info` : ```bash kubectl get secret sh.helm.release.v1.tomcat.v2 \ -o go-template='{{ .data.release | base64decode | base64decode }}' \ | gunzip -c > release-info ``` - Look at `release-info`: ```bash cat release-info ``` ] -- It's a bundle of ~~YAML~~ JSON. .debug[[k8s/helm-secrets.md](https://github.com/BretFisher/kubernetes-mastery/tree/mastery/slides/k8s/helm-secrets.md)] --- ## Looking at the JSON If we inspect that JSON (e.g. with `jq keys release-info`), we see: - `chart` (contains the entire chart used for that release) - `config` (contains the values that we've set) - `info` (date of deployment, status messages) - `manifest` (YAML generated from the templates) - `name` (name of the release, so `tomcat`) - `namespace` (namespace where we deployed the release) - `version` (revision number within that release; starts at 1) The chart is in a structured format, but it's entirely captured in this JSON. .debug[[k8s/helm-secrets.md](https://github.com/BretFisher/kubernetes-mastery/tree/mastery/slides/k8s/helm-secrets.md)] --- ## Conclusions - Helm stores each release information in a Secret in the namespace of the release - The secret is JSON object (gzipped and encoded in base64) - It contains the manifests generated for that release - ... And everything needed to rebuild these manifests (including the full source of the chart, and the values used) - This allows arbitrary rollbacks, as well as tweaking values even without having access to the source of the chart (or the chart repo) used for deployment .debug[[k8s/helm-secrets.md](https://github.com/BretFisher/kubernetes-mastery/tree/mastery/slides/k8s/helm-secrets.md)] --- class: pic .interstitial[] --- name: toc-network-policies class: title Network policies .nav[ [Previous section](#toc-helm-secrets) | [Back to table of contents](#toc-chapter-8) | [Next section](#toc-authentication-and-authorization) ] .debug[(automatically generated title slide)] --- # Network policies - Namespaces help us to *organize* resources - Namespaces do not provide isolation - By default, every pod can contact every other pod - By default, every service accepts traffic from anyone - If we want this to be different, we need *network policies* .debug[[k8s/netpol.md](https://github.com/BretFisher/kubernetes-mastery/tree/mastery/slides/k8s/netpol.md)] --- ## What's a network policy? A network policy is defined by the following things. - A *pod selector* indicating which pods it applies to e.g.: "all pods in namespace `blue` with the label `zone=internal`" - A list of *ingress rules* indicating which inbound traffic is allowed e.g.: "TCP connections to ports 8000 and 8080 coming from pods with label `zone=dmz`, and from the external subnet 4.42.6.0/24, except 4.42.6.5" - A list of *egress rules* indicating which outbound traffic is allowed A network policy can provide ingress rules, egress rules, or both. .debug[[k8s/netpol.md](https://github.com/BretFisher/kubernetes-mastery/tree/mastery/slides/k8s/netpol.md)] --- ## How do network policies apply? - A pod can be "selected" by any number of network policies - If a pod isn't selected by any network policy, then its traffic is unrestricted (In other words: in the absence of network policies, all traffic is allowed) - If a pod is selected by at least one network policy, then all traffic is blocked ... ... unless it is explicitly allowed by one of these network policies .debug[[k8s/netpol.md](https://github.com/BretFisher/kubernetes-mastery/tree/mastery/slides/k8s/netpol.md)] --- class: extra-details ## Traffic filtering is flow-oriented - Network policies deal with *connections*, not individual packets - Example: to allow HTTP (80/tcp) connections to pod A, you only need an ingress rule (You do not need a matching egress rule to allow response traffic to go through) - This also applies for UDP traffic (Allowing DNS traffic can be done with a single rule) - Network policy implementations use stateful connection tracking .debug[[k8s/netpol.md](https://github.com/BretFisher/kubernetes-mastery/tree/mastery/slides/k8s/netpol.md)] --- ## Pod-to-pod traffic - Connections from pod A to pod B have to be allowed by both pods: - pod A has to be unrestricted, or allow the connection as an *egress* rule - pod B has to be unrestricted, or allow the connection as an *ingress* rule - As a consequence: if a network policy restricts traffic going from/to a pod, <br/> the restriction cannot be overridden by a network policy selecting another pod - This prevents an entity managing network policies in namespace A (but without permission to do so in namespace B) from adding network policies giving them access to namespace B .debug[[k8s/netpol.md](https://github.com/BretFisher/kubernetes-mastery/tree/mastery/slides/k8s/netpol.md)] --- ## The rationale for network policies - In network security, it is generally considered better to "deny all, then allow selectively" (The other approach, "allow all, then block selectively" makes it too easy to leave holes) - As soon as one network policy selects a pod, the pod enters this "deny all" logic - Further network policies can open additional access - Good network policies should be scoped as precisely as possible - In particular: make sure that the selector is not too broad (Otherwise, you end up affecting pods that were otherwise well secured) .debug[[k8s/netpol.md](https://github.com/BretFisher/kubernetes-mastery/tree/mastery/slides/k8s/netpol.md)] --- ## Our first network policy This is our game plan: - run a web server in a pod - create a network policy to block all access to the web server - create another network policy to allow access only from specific pods .debug[[k8s/netpol.md](https://github.com/BretFisher/kubernetes-mastery/tree/mastery/slides/k8s/netpol.md)] --- ## Running our test web server .exercise[ - Let's use the `nginx` image: ```bash kubectl create deployment testweb --image=nginx ``` <!-- ```bash kubectl wait deployment testweb --for condition=available ``` --> - Find out the IP address of the pod with one of these two commands: ```bash kubectl get pods -o wide -l app=testweb IP=$(kubectl get pods -l app=testweb -o json | jq -r .items[0].status.podIP) ``` - Check that we can connect to the server: ```bash curl $IP ``` ] The `curl` command should show us the "Welcome to nginx!" page. .debug[[k8s/netpol.md](https://github.com/BretFisher/kubernetes-mastery/tree/mastery/slides/k8s/netpol.md)] --- ## Adding a very restrictive network policy - The policy will select pods with the label `app=testweb` - It will specify an empty list of ingress rules (matching nothing) .exercise[ - Apply the policy in this YAML file: ```bash kubectl apply -f ~/container.training/k8s/netpol-deny-all-for-testweb.yaml ``` - Check if we can still access the server: ```bash curl $IP ``` <!-- ```wait curl``` ```key ^C``` --> ] The `curl` command should now time out. .debug[[k8s/netpol.md](https://github.com/BretFisher/kubernetes-mastery/tree/mastery/slides/k8s/netpol.md)] --- ## Looking at the network policy This is the file that we applied: ```yaml kind: NetworkPolicy apiVersion: networking.k8s.io/v1 metadata: name: deny-all-for-testweb spec: podSelector: matchLabels: app: testweb ingress: [] ``` .debug[[k8s/netpol.md](https://github.com/BretFisher/kubernetes-mastery/tree/mastery/slides/k8s/netpol.md)] --- ## Allowing connections only from specific pods - We want to allow traffic from pods with the label `run=testcurl` - Reminder: this label is automatically applied when we do `kubectl run testcurl ...` .exercise[ - Apply another policy: ```bash kubectl apply -f ~/container.training/k8s/netpol-allow-testcurl-for-testweb.yaml ``` ] .debug[[k8s/netpol.md](https://github.com/BretFisher/kubernetes-mastery/tree/mastery/slides/k8s/netpol.md)] --- ## Looking at the network policy This is the second file that we applied: ```yaml kind: NetworkPolicy apiVersion: networking.k8s.io/v1 metadata: name: allow-testcurl-for-testweb spec: podSelector: matchLabels: app: testweb ingress: - from: - podSelector: matchLabels: run: testcurl ``` .debug[[k8s/netpol.md](https://github.com/BretFisher/kubernetes-mastery/tree/mastery/slides/k8s/netpol.md)] --- ## Testing the network policy - Let's create pods with, and without, the required label .exercise[ - Try to connect to testweb from a pod with the `run=testcurl` label: ```bash kubectl run testcurl --rm -i --image=centos -- curl -m3 $IP ``` - Try to connect to testweb with a different label: ```bash kubectl run testkurl --rm -i --image=centos -- curl -m3 $IP ``` ] The first command will work (and show the "Welcome to nginx!" page). The second command will fail and time out after 3 seconds. (The timeout is obtained with the `-m3` option.) .debug[[k8s/netpol.md](https://github.com/BretFisher/kubernetes-mastery/tree/mastery/slides/k8s/netpol.md)] --- ## An important warning - Some network plugins only have partial support for network policies - For instance, Weave added support for egress rules [in version 2.4](https://github.com/weaveworks/weave/pull/3313) (released in July 2018) - But only recently added support for ipBlock [in version 2.5](https://github.com/weaveworks/weave/pull/3367) (released in Nov 2018) - Unsupported features might be silently ignored (Making you believe that you are secure, when you're not) .debug[[k8s/netpol.md](https://github.com/BretFisher/kubernetes-mastery/tree/mastery/slides/k8s/netpol.md)] --- ## Network policies, pods, and services - Network policies apply to *pods* - A *service* can select multiple pods (And load balance traffic across them) - It is possible that we can connect to some pods, but not some others (Because of how network policies have been defined for these pods) - In that case, connections to the service will randomly pass or fail (Depending on whether the connection was sent to a pod that we have access to or not) .debug[[k8s/netpol.md](https://github.com/BretFisher/kubernetes-mastery/tree/mastery/slides/k8s/netpol.md)] --- ## Network policies and namespaces - A good strategy is to isolate a namespace, so that: - all the pods in the namespace can communicate together - other namespaces cannot access the pods - external access has to be enabled explicitly - Let's see what this would look like for the DockerCoins app! .debug[[k8s/netpol.md](https://github.com/BretFisher/kubernetes-mastery/tree/mastery/slides/k8s/netpol.md)] --- ## Network policies for DockerCoins - We are going to apply two policies - The first policy will prevent traffic from other namespaces - The second policy will allow traffic to the `webui` pods - That's all we need for that app! .debug[[k8s/netpol.md](https://github.com/BretFisher/kubernetes-mastery/tree/mastery/slides/k8s/netpol.md)] --- ## Blocking traffic from other namespaces This policy selects all pods in the current namespace. It allows traffic only from pods in the current namespace. (An empty `podSelector` means "all pods.") ```yaml kind: NetworkPolicy apiVersion: networking.k8s.io/v1 metadata: name: deny-from-other-namespaces spec: podSelector: {} ingress: - from: - podSelector: {} ``` .debug[[k8s/netpol.md](https://github.com/BretFisher/kubernetes-mastery/tree/mastery/slides/k8s/netpol.md)] --- ## Allowing traffic to `webui` pods This policy selects all pods with label `app=webui`. It allows traffic from any source. (An empty `from` field means "all sources.") ```yaml kind: NetworkPolicy apiVersion: networking.k8s.io/v1 metadata: name: allow-webui spec: podSelector: matchLabels: app: webui ingress: - from: [] ``` .debug[[k8s/netpol.md](https://github.com/BretFisher/kubernetes-mastery/tree/mastery/slides/k8s/netpol.md)] --- ## Applying both network policies - Both network policies are declared in the file `k8s/netpol-dockercoins.yaml` .exercise[ - Apply the network policies: ```bash kubectl apply -f ~/container.training/k8s/netpol-dockercoins.yaml ``` - Check that we can still access the web UI from outside <br/> (and that the app is still working correctly!) - Check that we can't connect anymore to `rng` or `hasher` through their ClusterIP ] Note: using `kubectl proxy` or `kubectl port-forward` allows us to connect regardless of existing network policies. This allows us to debug and troubleshoot easily, without having to poke holes in our firewall. .debug[[k8s/netpol.md](https://github.com/BretFisher/kubernetes-mastery/tree/mastery/slides/k8s/netpol.md)] --- ## Cleaning up our network policies - The network policies that we have installed block all traffic to the default namespace - We should remove them, otherwise further exercises will fail! .exercise[ - Remove all network policies: ```bash kubectl delete networkpolicies --all ``` ] .debug[[k8s/netpol.md](https://github.com/BretFisher/kubernetes-mastery/tree/mastery/slides/k8s/netpol.md)] --- ## Protecting the control plane - Should we add network policies to block unauthorized access to the control plane? (etcd, API server, etc.) -- - At first, it seems like a good idea ... -- - But it *shouldn't* be necessary: - not all network plugins support network policies - the control plane is secured by other methods (mutual TLS, mostly) - the code running in our pods can reasonably expect to contact the API <br/> (and it can do so safely thanks to the API permission model) - If we block access to the control plane, we might disrupt legitimate code - ...Without necessarily improving security .debug[[k8s/netpol.md](https://github.com/BretFisher/kubernetes-mastery/tree/mastery/slides/k8s/netpol.md)] --- ## Further resources - As always, the [Kubernetes documentation](https://kubernetes.io/docs/concepts/services-networking/network-policies/) is a good starting point - The API documentation has a lot of detail about the format of various objects: - [NetworkPolicy](https://kubernetes.io/docs/reference/generated/kubernetes-api/v1.12/#networkpolicy-v1-networking-k8s-io) - [NetworkPolicySpec](https://kubernetes.io/docs/reference/generated/kubernetes-api/v1.12/#networkpolicyspec-v1-networking-k8s-io) - [NetworkPolicyIngressRule](https://kubernetes.io/docs/reference/generated/kubernetes-api/v1.12/#networkpolicyingressrule-v1-networking-k8s-io) - etc. - And two resources by [Ahmet Alp Balkan](https://ahmet.im/): - a [very good talk about network policies](https://www.youtube.com/watch?list=PLj6h78yzYM2P-3-xqvmWaZbbI1sW-ulZb&v=3gGpMmYeEO8) at KubeCon North America 2017 - a repository of [ready-to-use recipes](https://github.com/ahmetb/kubernetes-network-policy-recipes) for network policies .debug[[k8s/netpol.md](https://github.com/BretFisher/kubernetes-mastery/tree/mastery/slides/k8s/netpol.md)] --- class: pic .interstitial[] --- name: toc-authentication-and-authorization class: title Authentication and authorization .nav[ [Previous section](#toc-network-policies) | [Back to table of contents](#toc-chapter-8) | [Next section](#toc-pod-security-policies) ] .debug[(automatically generated title slide)] --- # Authentication and authorization *And first, a little refresher!* - Authentication = verifying the identity of a person On a UNIX system, we can authenticate with login+password, SSH keys ... - Authorization = listing what they are allowed to do On a UNIX system, this can include file permissions, sudoer entries ... - Sometimes abbreviated as "authn" and "authz" - In good modular systems, these things are decoupled (so we can e.g. change a password or SSH key without having to reset access rights) .debug[[k8s/authn-authz.md](https://github.com/BretFisher/kubernetes-mastery/tree/mastery/slides/k8s/authn-authz.md)] --- ## Authentication in Kubernetes - When the API server receives a request, it tries to authenticate it (it examines headers, certificates... anything available) - Many authentication methods are available and can be used simultaneously (we will see them on the next slide) - It's the job of the authentication method to produce: - the user name - the user ID - a list of groups - The API server doesn't interpret these; that'll be the job of *authorizers* .debug[[k8s/authn-authz.md](https://github.com/BretFisher/kubernetes-mastery/tree/mastery/slides/k8s/authn-authz.md)] --- ## Authentication methods - TLS client certificates (that's what we've been doing with `kubectl` so far) - Bearer tokens (a secret token in the HTTP headers of the request) - [HTTP basic auth](https://en.wikipedia.org/wiki/Basic_access_authentication) (carrying user and password in an HTTP header) - Authentication proxy (sitting in front of the API and setting trusted headers) .debug[[k8s/authn-authz.md](https://github.com/BretFisher/kubernetes-mastery/tree/mastery/slides/k8s/authn-authz.md)] --- ## Anonymous requests - If any authentication method *rejects* a request, it's denied (`401 Unauthorized` HTTP code) - If a request is neither rejected nor accepted by anyone, it's anonymous - the user name is `system:anonymous` - the list of groups is `[system:unauthenticated]` - By default, the anonymous user can't do anything (that's what you get if you just `curl` the Kubernetes API) .debug[[k8s/authn-authz.md](https://github.com/BretFisher/kubernetes-mastery/tree/mastery/slides/k8s/authn-authz.md)] --- ## Authentication with TLS certificates - This is enabled in most Kubernetes deployments - The user name is derived from the `CN` in the client certificates - The groups are derived from the `O` fields in the client certificate - From the point of view of the Kubernetes API, users do not exist (i.e. they are not stored in etcd or anywhere else) - Users can be created (and added to groups) independently of the API - The Kubernetes API can be set up to use your custom CA to validate client certs .debug[[k8s/authn-authz.md](https://github.com/BretFisher/kubernetes-mastery/tree/mastery/slides/k8s/authn-authz.md)] --- class: extra-details ## Viewing our admin certificate - Let's inspect the certificate we've been using all this time! .exercise[ - This command will show the `CN` and `O` fields for our certificate: ```bash kubectl config view \ --raw \ -o json \ | jq -r .users[0].user[\"client-certificate-data\"] \ | openssl base64 -d -A \ | openssl x509 -text \ | grep Subject: ``` ] Let's break down that command together! 😅 .debug[[k8s/authn-authz.md](https://github.com/BretFisher/kubernetes-mastery/tree/mastery/slides/k8s/authn-authz.md)] --- class: extra-details ## Breaking down the command - `kubectl config view` shows the Kubernetes user configuration - `--raw` includes certificate information (which shows as REDACTED otherwise) - `-o json` outputs the information in JSON format - `| jq ...` extracts the field with the user certificate (in base64) - `| openssl base64 -d -A` decodes the base64 format (now we have a PEM file) - `| openssl x509 -text` parses the certificate and outputs it as plain text - `| grep Subject:` shows us the line that interests us → We are user `kubernetes-admin`, in group `system:masters`. (We will see later how and why this gives us the permissions that we have.) .debug[[k8s/authn-authz.md](https://github.com/BretFisher/kubernetes-mastery/tree/mastery/slides/k8s/authn-authz.md)] --- ## User certificates in practice - The Kubernetes API server does not support certificate revocation (see issue [#18982](https://github.com/kubernetes/kubernetes/issues/18982)) - As a result, we don't have an easy way to terminate someone's access (if their key is compromised, or they leave the organization) - Option 1: re-create a new CA and re-issue everyone's certificates <br/> → Maybe OK if we only have a few users; no way otherwise - Option 2: don't use groups; grant permissions to individual users <br/> → Inconvenient if we have many users and teams; error-prone - Option 3: issue short-lived certificates (e.g. 24 hours) and renew them often <br/> → This can be facilitated by e.g. Vault or by the Kubernetes CSR API .debug[[k8s/authn-authz.md](https://github.com/BretFisher/kubernetes-mastery/tree/mastery/slides/k8s/authn-authz.md)] --- ## Authentication with tokens - Tokens are passed as HTTP headers: `Authorization: Bearer and-then-here-comes-the-token` - Tokens can be validated through a number of different methods: - static tokens hard-coded in a file on the API server - [bootstrap tokens](https://kubernetes.io/docs/reference/access-authn-authz/bootstrap-tokens/) (special case to create a cluster or join nodes) - [OpenID Connect tokens](https://kubernetes.io/docs/reference/access-authn-authz/authentication/#openid-connect-tokens) (to delegate authentication to compatible OAuth2 providers) - service accounts (these deserve more details, coming right up!) .debug[[k8s/authn-authz.md](https://github.com/BretFisher/kubernetes-mastery/tree/mastery/slides/k8s/authn-authz.md)] --- ## Service accounts - A service account is a user that exists in the Kubernetes API (it is visible with e.g. `kubectl get serviceaccounts`) - Service accounts can therefore be created / updated dynamically (they don't require hand-editing a file and restarting the API server) - A service account is associated with a set of secrets (the kind that you can view with `kubectl get secrets`) - Service accounts are generally used to grant permissions to applications, services... (as opposed to humans) .debug[[k8s/authn-authz.md](https://github.com/BretFisher/kubernetes-mastery/tree/mastery/slides/k8s/authn-authz.md)] --- class: extra-details ## Token authentication in practice - We are going to list existing service accounts - Then we will extract the token for a given service account - And we will use that token to authenticate with the API .debug[[k8s/authn-authz.md](https://github.com/BretFisher/kubernetes-mastery/tree/mastery/slides/k8s/authn-authz.md)] --- class: extra-details ## Listing service accounts .exercise[ - The resource name is `serviceaccount` or `sa` for short: ```bash kubectl get sa ``` ] There should be just one service account in the default namespace: `default`. .debug[[k8s/authn-authz.md](https://github.com/BretFisher/kubernetes-mastery/tree/mastery/slides/k8s/authn-authz.md)] --- class: extra-details ## Finding the secret .exercise[ - List the secrets for the `default` service account: ```bash kubectl get sa default -o yaml SECRET=$(kubectl get sa default -o json | jq -r .secrets[0].name) ``` ] It should be named `default-token-XXXXX`. .debug[[k8s/authn-authz.md](https://github.com/BretFisher/kubernetes-mastery/tree/mastery/slides/k8s/authn-authz.md)] --- class: extra-details ## Extracting the token - The token is stored in the secret, wrapped with base64 encoding .exercise[ - View the secret: ```bash kubectl get secret $SECRET -o yaml ``` - Extract the token and decode it: ```bash TOKEN=$(kubectl get secret $SECRET -o json \ | jq -r .data.token | openssl base64 -d -A) ``` ] .debug[[k8s/authn-authz.md](https://github.com/BretFisher/kubernetes-mastery/tree/mastery/slides/k8s/authn-authz.md)] --- class: extra-details ## Using the token - Let's send a request to the API, without and with the token .exercise[ - Find the ClusterIP for the `kubernetes` service: ```bash kubectl get svc kubernetes API=$(kubectl get svc kubernetes -o json | jq -r .spec.clusterIP) ``` - Connect without the token: ```bash curl -k https://$API ``` - Connect with the token: ```bash curl -k -H "Authorization: Bearer $TOKEN" https://$API ``` ] .debug[[k8s/authn-authz.md](https://github.com/BretFisher/kubernetes-mastery/tree/mastery/slides/k8s/authn-authz.md)] --- class: extra-details ## Results - In both cases, we will get a "Forbidden" error - Without authentication, the user is `system:anonymous` - With authentication, it is shown as `system:serviceaccount:default:default` - The API "sees" us as a different user - But neither user has any rights, so we can't do nothin' - Let's change that! .debug[[k8s/authn-authz.md](https://github.com/BretFisher/kubernetes-mastery/tree/mastery/slides/k8s/authn-authz.md)] --- ## Authorization in Kubernetes - There are multiple ways to grant permissions in Kubernetes, called [authorizers](https://kubernetes.io/docs/reference/access-authn-authz/authorization/#authorization-modules): - [Node Authorization](https://kubernetes.io/docs/reference/access-authn-authz/node/) (used internally by kubelet; we can ignore it) - [Attribute-based access control](https://kubernetes.io/docs/reference/access-authn-authz/abac/) (powerful but complex and static; ignore it too) - [Webhook](https://kubernetes.io/docs/reference/access-authn-authz/webhook/) (each API request is submitted to an external service for approval) - [Role-based access control](https://kubernetes.io/docs/reference/access-authn-authz/rbac/) (associates permissions to users dynamically) - The one we want is the last one, generally abbreviated as RBAC .debug[[k8s/authn-authz.md](https://github.com/BretFisher/kubernetes-mastery/tree/mastery/slides/k8s/authn-authz.md)] --- ## Role-based access control - RBAC allows to specify fine-grained permissions - Permissions are expressed as *rules* - A rule is a combination of: - [verbs](https://kubernetes.io/docs/reference/access-authn-authz/authorization/#determine-the-request-verb) like create, get, list, update, delete... - resources (as in "API resource," like pods, nodes, services...) - resource names (to specify e.g. one specific pod instead of all pods) - in some case, [subresources](https://kubernetes.io/docs/reference/access-authn-authz/rbac/#referring-to-resources) (e.g. logs are subresources of pods) .debug[[k8s/authn-authz.md](https://github.com/BretFisher/kubernetes-mastery/tree/mastery/slides/k8s/authn-authz.md)] --- ## From rules to roles to rolebindings - A *role* is an API object containing a list of *rules* Example: role "external-load-balancer-configurator" can: - [list, get] resources [endpoints, services, pods] - [update] resources [services] - A *rolebinding* associates a role with a user Example: rolebinding "external-load-balancer-configurator": - associates user "external-load-balancer-configurator" - with role "external-load-balancer-configurator" - Yes, there can be users, roles, and rolebindings with the same name - It's a good idea for 1-1-1 bindings; not so much for 1-N ones .debug[[k8s/authn-authz.md](https://github.com/BretFisher/kubernetes-mastery/tree/mastery/slides/k8s/authn-authz.md)] --- ## Cluster-scope permissions - API resources Role and RoleBinding are for objects within a namespace - We can also define API resources ClusterRole and ClusterRoleBinding - These are a superset, allowing us to: - specify actions on cluster-wide objects (like nodes) - operate across all namespaces - We can create Role and RoleBinding resources within a namespace - ClusterRole and ClusterRoleBinding resources are global .debug[[k8s/authn-authz.md](https://github.com/BretFisher/kubernetes-mastery/tree/mastery/slides/k8s/authn-authz.md)] --- ## Pods and service accounts - A pod can be associated with a service account - by default, it is associated with the `default` service account - as we saw earlier, this service account has no permissions anyway - The associated token is exposed to the pod's filesystem (in `/var/run/secrets/kubernetes.io/serviceaccount/token`) - Standard Kubernetes tooling (like `kubectl`) will look for it there - So Kubernetes tools running in a pod will automatically use the service account .debug[[k8s/authn-authz.md](https://github.com/BretFisher/kubernetes-mastery/tree/mastery/slides/k8s/authn-authz.md)] --- ## In practice - We are going to create a service account - We will use a default cluster role (`view`) - We will bind together this role and this service account - Then we will run a pod using that service account - In this pod, we will install `kubectl` and check our permissions .debug[[k8s/authn-authz.md](https://github.com/BretFisher/kubernetes-mastery/tree/mastery/slides/k8s/authn-authz.md)] --- ## Creating a service account - We will call the new service account `viewer` (note that nothing prevents us from calling it `view`, like the role) .exercise[ - Create the new service account: ```bash kubectl create serviceaccount viewer ``` - List service accounts now: ```bash kubectl get serviceaccounts ``` ] .debug[[k8s/authn-authz.md](https://github.com/BretFisher/kubernetes-mastery/tree/mastery/slides/k8s/authn-authz.md)] --- ## Binding a role to the service account - Binding a role = creating a *rolebinding* object - We will call that object `viewercanview` (but again, we could call it `view`) .exercise[ - Create the new role binding: ```bash kubectl create rolebinding viewercanview \ --clusterrole=view \ --serviceaccount=default:viewer ``` ] It's important to note a couple of details in these flags... .debug[[k8s/authn-authz.md](https://github.com/BretFisher/kubernetes-mastery/tree/mastery/slides/k8s/authn-authz.md)] --- ## Roles vs Cluster Roles - We used `--clusterrole=view` - What would have happened if we had used `--role=view`? - we would have bound the role `view` from the local namespace <br/>(instead of the cluster role `view`) - the command would have worked fine (no error) - but later, our API requests would have been denied - This is a deliberate design decision (we can reference roles that don't exist, and create/update them later) .debug[[k8s/authn-authz.md](https://github.com/BretFisher/kubernetes-mastery/tree/mastery/slides/k8s/authn-authz.md)] --- ## Users vs Service Accounts - We used `--serviceaccount=default:viewer` - What would have happened if we had used `--user=default:viewer`? - we would have bound the role to a user instead of a service account - again, the command would have worked fine (no error) - ...but our API requests would have been denied later - What's about the `default:` prefix? - that's the namespace of the service account - yes, it could be inferred from context, but... `kubectl` requires it .debug[[k8s/authn-authz.md](https://github.com/BretFisher/kubernetes-mastery/tree/mastery/slides/k8s/authn-authz.md)] --- ## Testing - We will run an `alpine` pod and install `kubectl` there .exercise[ - Run a one-time pod: ```bash kubectl run eyepod --rm -ti --restart=Never \ --serviceaccount=viewer \ --image alpine ``` - Install `curl`, then use it to install `kubectl`: ```bash apk add --no-cache curl URLBASE=https://storage.googleapis.com/kubernetes-release/release KUBEVER=$(curl -s $URLBASE/stable.txt) curl -LO $URLBASE/$KUBEVER/bin/linux/amd64/kubectl chmod +x kubectl ``` ] .debug[[k8s/authn-authz.md](https://github.com/BretFisher/kubernetes-mastery/tree/mastery/slides/k8s/authn-authz.md)] --- ## Running `kubectl` in the pod - We'll try to use our `view` permissions, then to create an object .exercise[ - Check that we can, indeed, view things: ```bash ./kubectl get all ``` - But that we can't create things: ``` ./kubectl create deployment testrbac --image=nginx ``` - Exit the container with `exit` or `^D` <!-- ```key ^D``` --> ] .debug[[k8s/authn-authz.md](https://github.com/BretFisher/kubernetes-mastery/tree/mastery/slides/k8s/authn-authz.md)] --- ## Testing directly with `kubectl` - We can also check for permission with `kubectl auth can-i`: ```bash kubectl auth can-i list nodes kubectl auth can-i create pods kubectl auth can-i get pod/name-of-pod kubectl auth can-i get /url-fragment-of-api-request/ kubectl auth can-i '*' services ``` - And we can check permissions on behalf of other users: ```bash kubectl auth can-i list nodes \ --as some-user kubectl auth can-i list nodes \ --as system:serviceaccount:<namespace>:<name-of-service-account> ``` .debug[[k8s/authn-authz.md](https://github.com/BretFisher/kubernetes-mastery/tree/mastery/slides/k8s/authn-authz.md)] --- class: extra-details ## Where does this `view` role come from? - Kubernetes defines a number of ClusterRoles intended to be bound to users - `cluster-admin` can do *everything* (think `root` on UNIX) - `admin` can do *almost everything* (except e.g. changing resource quotas and limits) - `edit` is similar to `admin`, but cannot view or edit permissions - `view` has read-only access to most resources, except permissions and secrets *In many situations, these roles will be all you need.* *You can also customize them!* .debug[[k8s/authn-authz.md](https://github.com/BretFisher/kubernetes-mastery/tree/mastery/slides/k8s/authn-authz.md)] --- class: extra-details ## Customizing the default roles - If you need to *add* permissions to these default roles (or others), <br/> you can do it through the [ClusterRole Aggregation](https://kubernetes.io/docs/reference/access-authn-authz/rbac/#aggregated-clusterroles) mechanism - This happens by creating a ClusterRole with the following labels: ```yaml metadata: labels: rbac.authorization.k8s.io/aggregate-to-admin: "true" rbac.authorization.k8s.io/aggregate-to-edit: "true" rbac.authorization.k8s.io/aggregate-to-view: "true" ``` - This ClusterRole permissions will be added to `admin`/`edit`/`view` respectively - This is particulary useful when using CustomResourceDefinitions (since Kubernetes cannot guess which resources are sensitive and which ones aren't) .debug[[k8s/authn-authz.md](https://github.com/BretFisher/kubernetes-mastery/tree/mastery/slides/k8s/authn-authz.md)] --- class: extra-details ## Where do our permissions come from? - When interacting with the Kubernetes API, we are using a client certificate - We saw previously that this client certificate contained: `CN=kubernetes-admin` and `O=system:masters` - Let's look for these in existing ClusterRoleBindings: ```bash kubectl get clusterrolebindings -o yaml | grep -e kubernetes-admin -e system:masters ``` (`system:masters` should show up, but not `kubernetes-admin`.) - Where does this match come from? .debug[[k8s/authn-authz.md](https://github.com/BretFisher/kubernetes-mastery/tree/mastery/slides/k8s/authn-authz.md)] --- class: extra-details ## The `system:masters` group - If we eyeball the output of `kubectl get clusterrolebindings -o yaml`, we'll find out! - It is in the `cluster-admin` binding: ```bash kubectl describe clusterrolebinding cluster-admin ``` - This binding associates `system:masters` with the cluster role `cluster-admin` - And the `cluster-admin` is, basically, `root`: ```bash kubectl describe clusterrole cluster-admin ``` .debug[[k8s/authn-authz.md](https://github.com/BretFisher/kubernetes-mastery/tree/mastery/slides/k8s/authn-authz.md)] --- class: extra-details ## Figuring out who can do what - For auditing purposes, sometimes we want to know who can perform an action - There are a few tools to help us with that - [kubectl-who-can](https://github.com/aquasecurity/kubectl-who-can) by Aqua Security - [Review Access (aka Rakkess)](https://github.com/corneliusweig/rakkess) - Both are available as standalone programs, or as plugins for `kubectl` (`kubectl` plugins can be installed and managed with `krew`) .debug[[k8s/authn-authz.md](https://github.com/BretFisher/kubernetes-mastery/tree/mastery/slides/k8s/authn-authz.md)] --- class: pic .interstitial[] --- name: toc-pod-security-policies class: title Pod Security Policies .nav[ [Previous section](#toc-authentication-and-authorization) | [Back to table of contents](#toc-chapter-8) | [Next section](#toc-the-csr-api) ] .debug[(automatically generated title slide)] --- # Pod Security Policies - By default, our pods and containers can do *everything* (including taking over the entire cluster) - We are going to show an example of a malicious pod - Then we will explain how to avoid this with PodSecurityPolicies - We will enable PodSecurityPolicies on our cluster - We will create a couple of policies (restricted and permissive) - Finally we will see how to use them to improve security on our cluster .debug[[k8s/podsecuritypolicy.md](https://github.com/BretFisher/kubernetes-mastery/tree/mastery/slides/k8s/podsecuritypolicy.md)] --- ## Setting up a namespace - For simplicity, let's work in a separate namespace - Let's create a new namespace called "green" .exercise[ - Create the "green" namespace: ```bash kubectl create namespace green ``` - Change to that namespace: ```bash kns green ``` ] .debug[[k8s/podsecuritypolicy.md](https://github.com/BretFisher/kubernetes-mastery/tree/mastery/slides/k8s/podsecuritypolicy.md)] --- ## Creating a basic Deployment - Just to check that everything works correctly, deploy NGINX .exercise[ - Create a Deployment using the official NGINX image: ```bash kubectl create deployment web --image=nginx ``` - Confirm that the Deployment, ReplicaSet, and Pod exist, and that the Pod is running: ```bash kubectl get all ``` ] .debug[[k8s/podsecuritypolicy.md](https://github.com/BretFisher/kubernetes-mastery/tree/mastery/slides/k8s/podsecuritypolicy.md)] --- ## One example of malicious pods - We will now show an escalation technique in action - We will deploy a DaemonSet that adds our SSH key to the root account (on *each* node of the cluster) - The Pods of the DaemonSet will do so by mounting `/root` from the host .exercise[ - Check the file `k8s/hacktheplanet.yaml` with a text editor: ```bash vim ~/container.training/k8s/hacktheplanet.yaml ``` - If you would like, change the SSH key (by changing the GitHub user name) ] .debug[[k8s/podsecuritypolicy.md](https://github.com/BretFisher/kubernetes-mastery/tree/mastery/slides/k8s/podsecuritypolicy.md)] --- ## Deploying the malicious pods - Let's deploy our "exploit"! .exercise[ - Create the DaemonSet: ```bash kubectl create -f ~/container.training/k8s/hacktheplanet.yaml ``` - Check that the pods are running: ```bash kubectl get pods ``` - Confirm that the SSH key was added to the node's root account: ```bash sudo cat /root/.ssh/authorized_keys ``` ] .debug[[k8s/podsecuritypolicy.md](https://github.com/BretFisher/kubernetes-mastery/tree/mastery/slides/k8s/podsecuritypolicy.md)] --- ## Cleaning up - Before setting up our PodSecurityPolicies, clean up that namespace .exercise[ - Remove the DaemonSet: ```bash kubectl delete daemonset hacktheplanet ``` - Remove the Deployment: ```bash kubectl delete deployment web ``` ] .debug[[k8s/podsecuritypolicy.md](https://github.com/BretFisher/kubernetes-mastery/tree/mastery/slides/k8s/podsecuritypolicy.md)] --- ## Pod Security Policies in theory - To use PSPs, we need to activate their specific *admission controller* - That admission controller will intercept each pod creation attempt - It will look at: - *who/what* is creating the pod - which PodSecurityPolicies they can use - which PodSecurityPolicies can be used by the Pod's ServiceAccount - Then it will compare the Pod with each PodSecurityPolicy one by one - If a PodSecurityPolicy accepts all the parameters of the Pod, it is created - Otherwise, the Pod creation is denied and it won't even show up in `kubectl get pods` .debug[[k8s/podsecuritypolicy.md](https://github.com/BretFisher/kubernetes-mastery/tree/mastery/slides/k8s/podsecuritypolicy.md)] --- ## Pod Security Policies fine print - With RBAC, using a PSP corresponds to the verb `use` on the PSP (that makes sense, right?) - If no PSP is defined, no Pod can be created (even by cluster admins) - Pods that are already running are *not* affected - If we create a Pod directly, it can use a PSP to which *we* have access - If the Pod is created by e.g. a ReplicaSet or DaemonSet, it's different: - the ReplicaSet / DaemonSet controllers don't have access to *our* policies - therefore, we need to give access to the PSP to the Pod's ServiceAccount .debug[[k8s/podsecuritypolicy.md](https://github.com/BretFisher/kubernetes-mastery/tree/mastery/slides/k8s/podsecuritypolicy.md)] --- ## Pod Security Policies in practice - We are going to enable the PodSecurityPolicy admission controller - At that point, we won't be able to create any more pods (!) - Then we will create a couple of PodSecurityPolicies - ...And associated ClusterRoles (giving `use` access to the policies) - Then we will create RoleBindings to grant these roles to ServiceAccounts - We will verify that we can't run our "exploit" anymore .debug[[k8s/podsecuritypolicy.md](https://github.com/BretFisher/kubernetes-mastery/tree/mastery/slides/k8s/podsecuritypolicy.md)] --- ## Enabling Pod Security Policies - To enable Pod Security Policies, we need to enable their *admission plugin* - This is done by adding a flag to the API server - On clusters deployed with `kubeadm`, the control plane runs in static pods - These pods are defined in YAML files located in `/etc/kubernetes/manifests` - Kubelet watches this directory - Each time a file is added/removed there, kubelet creates/deletes the corresponding pod - Updating a file causes the pod to be deleted and recreated .debug[[k8s/podsecuritypolicy.md](https://github.com/BretFisher/kubernetes-mastery/tree/mastery/slides/k8s/podsecuritypolicy.md)] --- ## Updating the API server flags - Let's edit the manifest for the API server pod .exercise[ - Have a look at the static pods: ```bash ls -l /etc/kubernetes/manifests ``` - Edit the one corresponding to the API server: ```bash sudo vim /etc/kubernetes/manifests/kube-apiserver.yaml ``` <!-- ```wait apiVersion``` --> ] .debug[[k8s/podsecuritypolicy.md](https://github.com/BretFisher/kubernetes-mastery/tree/mastery/slides/k8s/podsecuritypolicy.md)] --- ## Adding the PSP admission plugin - There should already be a line with `--enable-admission-plugins=...` - Let's add `PodSecurityPolicy` on that line .exercise[ - Locate the line with `--enable-admission-plugins=` - Add `PodSecurityPolicy` It should read: `--enable-admission-plugins=NodeRestriction,PodSecurityPolicy` - Save, quit <!-- ```keys /--enable-admission-plugins=``` ```key ^J``` ```key $``` ```keys a,PodSecurityPolicy``` ```key Escape``` ```keys :wq``` ```key ^J``` --> ] .debug[[k8s/podsecuritypolicy.md](https://github.com/BretFisher/kubernetes-mastery/tree/mastery/slides/k8s/podsecuritypolicy.md)] --- ## Waiting for the API server to restart - The kubelet detects that the file was modified - It kills the API server pod, and starts a new one - During that time, the API server is unavailable .exercise[ - Wait until the API server is available again ] .debug[[k8s/podsecuritypolicy.md](https://github.com/BretFisher/kubernetes-mastery/tree/mastery/slides/k8s/podsecuritypolicy.md)] --- ## Check that the admission plugin is active - Normally, we can't create any Pod at this point .exercise[ - Try to create a Pod directly: ```bash kubectl run testpsp1 --image=nginx --restart=Never ``` <!-- ```wait forbidden: no providers available``` --> - Try to create a Deployment: ```bash kubectl run testpsp2 --image=nginx ``` - Look at existing resources: ```bash kubectl get all ``` ] We can get hints at what's happening by looking at the ReplicaSet and Events. .debug[[k8s/podsecuritypolicy.md](https://github.com/BretFisher/kubernetes-mastery/tree/mastery/slides/k8s/podsecuritypolicy.md)] --- ## Introducing our Pod Security Policies - We will create two policies: - privileged (allows everything) - restricted (blocks some unsafe mechanisms) - For each policy, we also need an associated ClusterRole granting *use* .debug[[k8s/podsecuritypolicy.md](https://github.com/BretFisher/kubernetes-mastery/tree/mastery/slides/k8s/podsecuritypolicy.md)] --- ## Creating our Pod Security Policies - We have a couple of files, each defining a PSP and associated ClusterRole: - k8s/psp-privileged.yaml: policy `privileged`, role `psp:privileged` - k8s/psp-restricted.yaml: policy `restricted`, role `psp:restricted` .exercise[ - Create both policies and their associated ClusterRoles: ```bash kubectl create -f ~/container.training/k8s/psp-restricted.yaml kubectl create -f ~/container.training/k8s/psp-privileged.yaml ``` ] - The privileged policy comes from [the Kubernetes documentation](https://kubernetes.io/docs/concepts/policy/pod-security-policy/#example-policies) - The restricted policy is inspired by that same documentation page .debug[[k8s/podsecuritypolicy.md](https://github.com/BretFisher/kubernetes-mastery/tree/mastery/slides/k8s/podsecuritypolicy.md)] --- ## Check that we can create Pods again - We haven't bound the policy to any user yet - But `cluster-admin` can implicitly `use` all policies .exercise[ - Check that we can now create a Pod directly: ```bash kubectl run testpsp3 --image=nginx --restart=Never ``` - Create a Deployment as well: ```bash kubectl run testpsp4 --image=nginx ``` - Confirm that the Deployment is *not* creating any Pods: ```bash kubectl get all ``` ] .debug[[k8s/podsecuritypolicy.md](https://github.com/BretFisher/kubernetes-mastery/tree/mastery/slides/k8s/podsecuritypolicy.md)] --- ## What's going on? - We can create Pods directly (thanks to our root-like permissions) - The Pods corresponding to a Deployment are created by the ReplicaSet controller - The ReplicaSet controller does *not* have root-like permissions - We need to either: - grant permissions to the ReplicaSet controller *or* - grant permissions to our Pods' ServiceAccount - The first option would allow *anyone* to create pods - The second option will allow us to scope the permissions better .debug[[k8s/podsecuritypolicy.md](https://github.com/BretFisher/kubernetes-mastery/tree/mastery/slides/k8s/podsecuritypolicy.md)] --- ## Binding the restricted policy - Let's bind the role `psp:restricted` to ServiceAccount `green:default` (aka the default ServiceAccount in the green Namespace) - This will allow Pod creation in the green Namespace (because these Pods will be using that ServiceAccount automatically) .exercise[ - Create the following RoleBinding: ```bash kubectl create rolebinding psp:restricted \ --clusterrole=psp:restricted \ --serviceaccount=green:default ``` ] .debug[[k8s/podsecuritypolicy.md](https://github.com/BretFisher/kubernetes-mastery/tree/mastery/slides/k8s/podsecuritypolicy.md)] --- ## Trying it out - The Deployments that we created earlier will *eventually* recover (the ReplicaSet controller will retry to create Pods once in a while) - If we create a new Deployment now, it should work immediately .exercise[ - Create a simple Deployment: ```bash kubectl create deployment testpsp5 --image=nginx ``` - Look at the Pods that have been created: ```bash kubectl get all ``` ] .debug[[k8s/podsecuritypolicy.md](https://github.com/BretFisher/kubernetes-mastery/tree/mastery/slides/k8s/podsecuritypolicy.md)] --- ## Trying to hack the cluster - Let's create the same DaemonSet we used earlier .exercise[ - Create a hostile DaemonSet: ```bash kubectl create -f ~/container.training/k8s/hacktheplanet.yaml ``` - Look at the state of the namespace: ```bash kubectl get all ``` ] .debug[[k8s/podsecuritypolicy.md](https://github.com/BretFisher/kubernetes-mastery/tree/mastery/slides/k8s/podsecuritypolicy.md)] --- class: extra-details ## What's in our restricted policy? - The restricted PSP is similar to the one provided in the docs, but: - it allows containers to run as root - it doesn't drop capabilities - Many containers run as root by default, and would require additional tweaks - Many containers use e.g. `chown`, which requires a specific capability (that's the case for the NGINX official image, for instance) - We still block: hostPath, privileged containers, and much more! .debug[[k8s/podsecuritypolicy.md](https://github.com/BretFisher/kubernetes-mastery/tree/mastery/slides/k8s/podsecuritypolicy.md)] --- class: extra-details ## The case of static pods - If we list the pods in the `kube-system` namespace, `kube-apiserver` is missing - However, the API server is obviously running (otherwise, `kubectl get pods --namespace=kube-system` wouldn't work) - The API server Pod is created directly by kubelet (without going through the PSP admission plugin) - Then, kubelet creates a "mirror pod" representing that Pod in etcd - That "mirror pod" creation goes through the PSP admission plugin - And it gets blocked! - This can be fixed by binding `psp:privileged` to group `system:nodes` .debug[[k8s/podsecuritypolicy.md](https://github.com/BretFisher/kubernetes-mastery/tree/mastery/slides/k8s/podsecuritypolicy.md)] --- ## .warning[Before moving on...] - Our cluster is currently broken (we can't create pods in namespaces kube-system, default, ...) - We need to either: - disable the PSP admission plugin - allow use of PSP to relevant users and groups - For instance, we could: - bind `psp:restricted` to the group `system:authenticated` - bind `psp:privileged` to the ServiceAccount `kube-system:default` .debug[[k8s/podsecuritypolicy.md](https://github.com/BretFisher/kubernetes-mastery/tree/mastery/slides/k8s/podsecuritypolicy.md)] --- ## Fixing the cluster - Let's disable the PSP admission plugin .exercise[ - Edit the Kubernetes API server static pod manifest - Remove the PSP admission plugin - This can be done with this one-liner: ```bash sudo sed -i s/,PodSecurityPolicy// /etc/kubernetes/manifests/kube-apiserver.yaml ``` ] .debug[[k8s/podsecuritypolicy.md](https://github.com/BretFisher/kubernetes-mastery/tree/mastery/slides/k8s/podsecuritypolicy.md)] --- class: pic .interstitial[] --- name: toc-the-csr-api class: title The CSR API .nav[ [Previous section](#toc-pod-security-policies) | [Back to table of contents](#toc-chapter-8) | [Next section](#toc-openid-connect) ] .debug[(automatically generated title slide)] --- # The CSR API - The Kubernetes API exposes CSR resources - We can use these resources to issue TLS certificates - First, we will go through a quick reminder about TLS certificates - Then, we will see how to obtain a certificate for a user - We will use that certificate to authenticate with the cluster - Finally, we will grant some privileges to that user .debug[[k8s/csr-api.md](https://github.com/BretFisher/kubernetes-mastery/tree/mastery/slides/k8s/csr-api.md)] --- ## Reminder about TLS - TLS (Transport Layer Security) is a protocol providing: - encryption (to prevent eavesdropping) - authentication (using public key cryptography) - When we access an https:// URL, the server authenticates itself (it proves its identity to us; as if it were "showing its ID") - But we can also have mutual TLS authentication (mTLS) (client proves its identity to server; server proves its identity to client) .debug[[k8s/csr-api.md](https://github.com/BretFisher/kubernetes-mastery/tree/mastery/slides/k8s/csr-api.md)] --- ## Authentication with certificates - To authenticate, someone (client or server) needs: - a *private key* (that remains known only to them) - a *public key* (that they can distribute) - a *certificate* (associating the public key with an identity) - A message encrypted with the private key can only be decrypted with the public key (and vice versa) - If I use someone's public key to encrypt/decrypt their messages, <br/> I can be certain that I am talking to them / they are talking to me - The certificate proves that I have the correct public key for them .debug[[k8s/csr-api.md](https://github.com/BretFisher/kubernetes-mastery/tree/mastery/slides/k8s/csr-api.md)] --- ## Certificate generation workflow This is what I do if I want to obtain a certificate. 1. Create public and private keys. 2. Create a Certificate Signing Request (CSR). (The CSR contains the identity that I claim and a public key.) 3. Send that CSR to the Certificate Authority (CA). 4. The CA verifies that I can claim the identity in the CSR. 5. The CA generates my certificate and gives it to me. The CA (or anyone else) never needs to know my private key. .debug[[k8s/csr-api.md](https://github.com/BretFisher/kubernetes-mastery/tree/mastery/slides/k8s/csr-api.md)] --- ## The CSR API - The Kubernetes API has a CertificateSigningRequest resource type (we can list them with e.g. `kubectl get csr`) - We can create a CSR object (= upload a CSR to the Kubernetes API) - Then, using the Kubernetes API, we can approve/deny the request - If we approve the request, the Kubernetes API generates a certificate - The certificate gets attached to the CSR object and can be retrieved .debug[[k8s/csr-api.md](https://github.com/BretFisher/kubernetes-mastery/tree/mastery/slides/k8s/csr-api.md)] --- ## Using the CSR API - We will show how to use the CSR API to obtain user certificates - This will be a rather complex demo - ... And yet, we will take a few shortcuts to simplify it (but it will illustrate the general idea) - The demo also won't be automated (we would have to write extra code to make it fully functional) .debug[[k8s/csr-api.md](https://github.com/BretFisher/kubernetes-mastery/tree/mastery/slides/k8s/csr-api.md)] --- ## General idea - We will create a Namespace named "users" - Each user will get a ServiceAccount in that Namespace - That ServiceAccount will give read/write access to *one* CSR object - Users will use that ServiceAccount's token to submit a CSR - We will approve the CSR (or not) - Users can then retrieve their certificate from their CSR object - ...And use that certificate for subsequent interactions .debug[[k8s/csr-api.md](https://github.com/BretFisher/kubernetes-mastery/tree/mastery/slides/k8s/csr-api.md)] --- ## Resource naming For a user named `jean.doe`, we will have: - ServiceAccount `jean.doe` in Namespace `users` - CertificateSigningRequest `users:jean.doe` - ClusterRole `users:jean.doe` giving read/write access to that CSR - ClusterRoleBinding `users:jean.doe` binding ClusterRole and ServiceAccount .debug[[k8s/csr-api.md](https://github.com/BretFisher/kubernetes-mastery/tree/mastery/slides/k8s/csr-api.md)] --- ## Creating the user's resources .warning[If you want to use another name than `jean.doe`, update the YAML file!] .exercise[ - Create the global namespace for all users: ```bash kubectl create namespace users ``` - Create the ServiceAccount, ClusterRole, ClusterRoleBinding for `jean.doe`: ```bash kubectl apply -f ~/container.training/k8s/users:jean.doe.yaml ``` ] .debug[[k8s/csr-api.md](https://github.com/BretFisher/kubernetes-mastery/tree/mastery/slides/k8s/csr-api.md)] --- ## Extracting the user's token - Let's obtain the user's token and give it to them (the token will be their password) .exercise[ - List the user's secrets: ```bash kubectl --namespace=users describe serviceaccount jean.doe ``` - Show the user's token: ```bash kubectl --namespace=users describe secret `jean.doe-token-xxxxx` ``` ] .debug[[k8s/csr-api.md](https://github.com/BretFisher/kubernetes-mastery/tree/mastery/slides/k8s/csr-api.md)] --- ## Configure `kubectl` to use the token - Let's create a new context that will use that token to access the API .exercise[ - Add a new identity to our kubeconfig file: ```bash kubectl config set-credentials token:jean.doe --token=... ``` - Add a new context using that identity: ```bash kubectl config set-context jean.doe --user=token:jean.doe --cluster=kubernetes ``` ] .debug[[k8s/csr-api.md](https://github.com/BretFisher/kubernetes-mastery/tree/mastery/slides/k8s/csr-api.md)] --- ## Access the API with the token - Let's check that our access rights are set properly .exercise[ - Try to access any resource: ```bash kubectl get pods ``` (This should tell us "Forbidden") - Try to access "our" CertificateSigningRequest: ```bash kubectl get csr users:jean.doe ``` (This should tell us "NotFound") ] .debug[[k8s/csr-api.md](https://github.com/BretFisher/kubernetes-mastery/tree/mastery/slides/k8s/csr-api.md)] --- ## Create a key and a CSR - There are many tools to generate TLS keys and CSRs - Let's use OpenSSL; it's not the best one, but it's installed everywhere (many people prefer cfssl, easyrsa, or other tools; that's fine too!) .exercise[ - Generate the key and certificate signing request: ```bash openssl req -newkey rsa:2048 -nodes -keyout key.pem \ -new -subj /CN=jean.doe/O=devs/ -out csr.pem ``` ] The command above generates: - a 2048-bit RSA key, without encryption, stored in key.pem - a CSR for the name `jean.doe` in group `devs` .debug[[k8s/csr-api.md](https://github.com/BretFisher/kubernetes-mastery/tree/mastery/slides/k8s/csr-api.md)] --- ## Inside the Kubernetes CSR object - The Kubernetes CSR object is a thin wrapper around the CSR PEM file - The PEM file needs to be encoded to base64 on a single line (we will use `base64 -w0` for that purpose) - The Kubernetes CSR object also needs to list the right "usages" (these are flags indicating how the certificate can be used) .debug[[k8s/csr-api.md](https://github.com/BretFisher/kubernetes-mastery/tree/mastery/slides/k8s/csr-api.md)] --- ## Sending the CSR to Kubernetes .exercise[ - Generate and create the CSR resource: ```bash kubectl apply -f - <<EOF apiVersion: certificates.k8s.io/v1beta1 kind: CertificateSigningRequest metadata: name: users:jean.doe spec: request: $(base64 -w0 < csr.pem) usages: - digital signature - key encipherment - client auth EOF ``` ] .debug[[k8s/csr-api.md](https://github.com/BretFisher/kubernetes-mastery/tree/mastery/slides/k8s/csr-api.md)] --- ## Adjusting certificate expiration - By default, the CSR API generates certificates valid 1 year - We want to generate short-lived certificates, so we will lower that to 1 hour - Fow now, this is configured [through an experimental controller manager flag](https://github.com/kubernetes/kubernetes/issues/67324) .exercise[ - Edit the static pod definition for the controller manager: ```bash sudo vim /etc/kubernetes/manifests/kube-controller-manager.yaml ``` - In the list of flags, add the following line: ```bash - --experimental-cluster-signing-duration=1h ``` ] .debug[[k8s/csr-api.md](https://github.com/BretFisher/kubernetes-mastery/tree/mastery/slides/k8s/csr-api.md)] --- ## Verifying and approving the CSR - Let's inspect the CSR, and if it is valid, approve it .exercise[ - Switch back to `cluster-admin`: ```bash kctx - ``` - Inspect the CSR: ```bash kubectl describe csr users:jean.doe ``` - Approve it: ```bash kubectl certificate approve users:jean.doe ``` ] .debug[[k8s/csr-api.md](https://github.com/BretFisher/kubernetes-mastery/tree/mastery/slides/k8s/csr-api.md)] --- ## Obtaining the certificate .exercise[ - Switch back to the user's identity: ```bash kctx - ``` - Retrieve the updated CSR object and extract the certificate: ```bash kubectl get csr users:jean.doe \ -o jsonpath={.status.certificate} \ | base64 -d > cert.pem ``` - Inspect the certificate: ```bash openssl x509 -in cert.pem -text -noout ``` ] .debug[[k8s/csr-api.md](https://github.com/BretFisher/kubernetes-mastery/tree/mastery/slides/k8s/csr-api.md)] --- ## Using the certificate .exercise[ - Add the key and certificate to kubeconfig: ```bash kubectl config set-credentials cert:jean.doe --embed-certs \ --client-certificate=cert.pem --client-key=key.pem ``` - Update the user's context to use the key and cert to authenticate: ```bash kubectl config set-context jean.doe --user cert:jean.doe ``` - Confirm that we are seen as `jean.doe` (but don't have permissions): ```bash kubectl get pods ``` ] .debug[[k8s/csr-api.md](https://github.com/BretFisher/kubernetes-mastery/tree/mastery/slides/k8s/csr-api.md)] --- ## What's missing? We have just shown, step by step, a method to issue short-lived certificates for users. To be usable in real environments, we would need to add: - a kubectl helper to automatically generate the CSR and obtain the cert (and transparently renew the cert when needed) - a Kubernetes controller to automatically validate and approve CSRs (checking that the subject and groups are valid) - a way for the users to know the groups to add to their CSR (e.g.: annotations on their ServiceAccount + read access to the ServiceAccount) .debug[[k8s/csr-api.md](https://github.com/BretFisher/kubernetes-mastery/tree/mastery/slides/k8s/csr-api.md)] --- ## Is this realistic? - Larger organizations typically integrate with their own directory - The general principle, however, is the same: - users have long-term credentials (password, token, ...) - they use these credentials to obtain other, short-lived credentials - This provides enhanced security: - the long-term credentials can use long passphrases, 2FA, HSM... - the short-term credentials are more convenient to use - we get strong security *and* convenience - Systems like Vault also have certificate issuance mechanisms .debug[[k8s/csr-api.md](https://github.com/BretFisher/kubernetes-mastery/tree/mastery/slides/k8s/csr-api.md)] --- class: pic .interstitial[] --- name: toc-openid-connect class: title OpenID Connect .nav[ [Previous section](#toc-the-csr-api) | [Back to table of contents](#toc-chapter-8) | [Next section](#toc-securing-the-control-plane) ] .debug[(automatically generated title slide)] --- # OpenID Connect - The Kubernetes API server can perform authentication with OpenID connect - This requires an *OpenID provider* (external authorization server using the OAuth 2.0 protocol) - We can use a third-party provider (e.g. Google) or run our own (e.g. Dex) - We are going to give an overview of the protocol - We will show it in action (in a simplified scenario) .debug[[k8s/openid-connect.md](https://github.com/BretFisher/kubernetes-mastery/tree/mastery/slides/k8s/openid-connect.md)] --- ## Workflow overview - We want to access our resources (a Kubernetes cluster) - We authenticate with the OpenID provider - we can do this directly (e.g. by going to https://accounts.google.com) - or maybe a kubectl plugin can open a browser page on our behalf - After authenticating us, the OpenID provider gives us: - an *id token* (a short-lived signed JSON Web Token, see next slide) - a *refresh token* (to renew the *id token* when needed) - We can now issue requests to the Kubernetes API with the *id token* - The API server will verify that token's content to authenticate us .debug[[k8s/openid-connect.md](https://github.com/BretFisher/kubernetes-mastery/tree/mastery/slides/k8s/openid-connect.md)] --- ## JSON Web Tokens - A JSON Web Token (JWT) has three parts: - a header specifying algorithms and token type - a payload (indicating who issued the token, for whom, which purposes...) - a signature generated by the issuer (the issuer = the OpenID provider) - Anyone can verify a JWT without contacting the issuer (except to obtain the issuer's public key) - Pro tip: we can inspect a JWT with https://jwt.io/ .debug[[k8s/openid-connect.md](https://github.com/BretFisher/kubernetes-mastery/tree/mastery/slides/k8s/openid-connect.md)] --- ## How the Kubernetes API uses JWT - Server side - enable OIDC authentication - indicate which issuer (provider) should be allowed - indicate which audience (or "client id") should be allowed - optionally, map or prefix user and group names - Client side - obtain JWT as described earlier - pass JWT as authentication token - renew JWT when needed (using the refresh token) .debug[[k8s/openid-connect.md](https://github.com/BretFisher/kubernetes-mastery/tree/mastery/slides/k8s/openid-connect.md)] --- ## Demo time! - We will use [Google Accounts](https://accounts.google.com) as our OpenID provider - We will use the [Google OAuth Playground](https://developers.google.com/oauthplayground) as the "audience" or "client id" - We will obtain a JWT through Google Accounts and the OAuth Playground - We will enable OIDC in the Kubernetes API server - We will use the JWT to authenticate .footnote[If you can't or won't use a Google account, you can try to adapt this to another provider.] .debug[[k8s/openid-connect.md](https://github.com/BretFisher/kubernetes-mastery/tree/mastery/slides/k8s/openid-connect.md)] --- ## Checking the API server logs - The API server logs will be particularly useful in this section (they will indicate e.g. why a specific token is rejected) - Let's keep an eye on the API server output! .exercise[ - Tail the logs of the API server: ```bash kubectl logs kube-apiserver-node1 --follow --namespace=kube-system ``` ] .debug[[k8s/openid-connect.md](https://github.com/BretFisher/kubernetes-mastery/tree/mastery/slides/k8s/openid-connect.md)] --- ## Authenticate with the OpenID provider - We will use the Google OAuth Playground for convenience - In a real scenario, we would need our own OAuth client instead of the playground (even if we were still using Google as the OpenID provider) .exercise[ - Open the Google OAuth Playground: ``` https://developers.google.com/oauthplayground/ ``` - Enter our own custom scope in the text field: ``` https://www.googleapis.com/auth/userinfo.email ``` - Click on "Authorize APIs" and allow the playground to access our email address ] .debug[[k8s/openid-connect.md](https://github.com/BretFisher/kubernetes-mastery/tree/mastery/slides/k8s/openid-connect.md)] --- ## Obtain our JSON Web Token - The previous step gave us an "authorization code" - We will use it to obtain tokens .exercise[ - Click on "Exchange authorization code for tokens" ] - The JWT is the very long `id_token` that shows up on the right hand side (it is a base64-encoded JSON object, and should therefore start with `eyJ`) .debug[[k8s/openid-connect.md](https://github.com/BretFisher/kubernetes-mastery/tree/mastery/slides/k8s/openid-connect.md)] --- ## Using our JSON Web Token - We need to create a context (in kubeconfig) for our token (if we just add the token or use `kubectl --token`, our certificate will still be used) .exercise[ - Create a new authentication section in kubeconfig: ```bash kubectl config set-credentials myjwt --token=eyJ... ``` - Try to use it: ```bash kubectl --user=myjwt get nodes ``` ] We should get an `Unauthorized` response, since we haven't enabled OpenID Connect in the API server yet. We should also see `invalid bearer token` in the API server log output. .debug[[k8s/openid-connect.md](https://github.com/BretFisher/kubernetes-mastery/tree/mastery/slides/k8s/openid-connect.md)] --- ## Enabling OpenID Connect - We need to add a few flags to the API server configuration - These two are mandatory: `--oidc-issuer-url` → URL of the OpenID provider `--oidc-client-id` → app requesting the authentication <br/>(in our case, that's the ID for the Google OAuth Playground) - This one is optional: `--oidc-username-claim` → which field should be used as user name <br/>(we will use the user's email address instead of an opaque ID) - See the [API server documentation](https://kubernetes.io/docs/reference/access-authn-authz/authentication/#configuring-the-api-server ) for more details about all available flags .debug[[k8s/openid-connect.md](https://github.com/BretFisher/kubernetes-mastery/tree/mastery/slides/k8s/openid-connect.md)] --- ## Updating the API server configuration - The instructions below will work for clusters deployed with kubeadm (or where the control plane is deployed in static pods) - If your cluster is deployed differently, you will need to adapt them .exercise[ - Edit `/etc/kubernetes/manifests/kube-apiserver.yaml` - Add the following lines to the list of command-line flags: ```yaml - --oidc-issuer-url=https://accounts.google.com - --oidc-client-id=407408718192.apps.googleusercontent.com - --oidc-username-claim=email ``` ] .debug[[k8s/openid-connect.md](https://github.com/BretFisher/kubernetes-mastery/tree/mastery/slides/k8s/openid-connect.md)] --- ## Restarting the API server - The kubelet monitors the files in `/etc/kubernetes/manifests` - When we save the pod manifest, kubelet will restart the corresponding pod (using the updated command line flags) .exercise[ - After making the changes described on the previous slide, save the file - Issue a simple command (like `kubectl version`) until the API server is back up (it might take between a few seconds and one minute for the API server to restart) - Restart the `kubectl logs` command to view the logs of the API server ] .debug[[k8s/openid-connect.md](https://github.com/BretFisher/kubernetes-mastery/tree/mastery/slides/k8s/openid-connect.md)] --- ## Using our JSON Web Token - Now that the API server is set up to recognize our token, try again! .exercise[ - Try an API command with our token: ```bash kubectl --user=myjwt get nodes kubectl --user=myjwt get pods ``` ] We should see a message like: ``` Error from server (Forbidden): nodes is forbidden: User "jean.doe@gmail.com" cannot list resource "nodes" in API group "" at the cluster scope ``` → We were successfully *authenticated*, but not *authorized*. .debug[[k8s/openid-connect.md](https://github.com/BretFisher/kubernetes-mastery/tree/mastery/slides/k8s/openid-connect.md)] --- ## Authorizing our user - As an extra step, let's grant read access to our user - We will use the pre-defined ClusterRole `view` .exercise[ - Create a ClusterRoleBinding allowing us to view resources: ```bash kubectl create clusterrolebinding i-can-view \ --user=`jean.doe@gmail.com` --clusterrole=view ``` (make sure to put *your* Google email address there) - Confirm that we can now list pods with our token: ```bash kubectl --user=myjwt get pods ``` ] .debug[[k8s/openid-connect.md](https://github.com/BretFisher/kubernetes-mastery/tree/mastery/slides/k8s/openid-connect.md)] --- ## From demo to production .warning[This was a very simplified demo! In a real deployment...] - We wouldn't use the Google OAuth Playground - We *probably* wouldn't even use Google at all (it doesn't seem to provide a way to include groups!) - Some popular alternatives: - [Dex](https://github.com/dexidp/dex), [Keycloak](https://www.keycloak.org/) (self-hosted) - [Okta](https://developer.okta.com/docs/how-to/creating-token-with-groups-claim/#step-five-decode-the-jwt-to-verify) (SaaS) - We would use a helper (like the [kubelogin](https://github.com/int128/kubelogin) plugin) to automatically obtain tokens .debug[[k8s/openid-connect.md](https://github.com/BretFisher/kubernetes-mastery/tree/mastery/slides/k8s/openid-connect.md)] --- class: extra-details ## Service Account tokens - The tokens used by Service Accounts are JWT tokens as well - They are signed and verified using a special service account key pair .exercise[ - Extract the token of a service account in the current namespace: ```bash kubectl get secrets -o jsonpath={..token} | base64 -d ``` - Copy-paste the token to a verification service like https://jwt.io - Notice that it says "Invalid Signature" ] .debug[[k8s/openid-connect.md](https://github.com/BretFisher/kubernetes-mastery/tree/mastery/slides/k8s/openid-connect.md)] --- class: extra-details ## Verifying Service Account tokens - JSON Web Tokens embed the URL of the "issuer" (=OpenID provider) - The issuer provides its public key through a well-known discovery endpoint (similar to https://accounts.google.com/.well-known/openid-configuration) - There is no such endpoint for the Service Account key pair - But we can provide the public key ourselves for verification .debug[[k8s/openid-connect.md](https://github.com/BretFisher/kubernetes-mastery/tree/mastery/slides/k8s/openid-connect.md)] --- class: extra-details ## Verifying a Service Account token - On clusters provisioned with kubeadm, the Service Account key pair is: `/etc/kubernetes/pki/sa.key` (used by the controller manager to generate tokens) `/etc/kubernetes/pki/sa.pub` (used by the API server to validate the same tokens) .exercise[ - Display the public key used to sign Service Account tokens: ```bash sudo cat /etc/kubernetes/pki/sa.pub ``` - Copy-paste the key in the "verify signature" area on https://jwt.io - It should now say "Signature Verified" ] .debug[[k8s/openid-connect.md](https://github.com/BretFisher/kubernetes-mastery/tree/mastery/slides/k8s/openid-connect.md)] --- class: pic .interstitial[] --- name: toc-securing-the-control-plane class: title Securing the control plane .nav[ [Previous section](#toc-openid-connect) | [Back to table of contents](#toc-chapter-8) | [Next section](#toc-volumes) ] .debug[(automatically generated title slide)] --- # Securing the control plane - Many components accept connections (and requests) from others: - API server - etcd - kubelet - We must secure these connections: - to deny unauthorized requests - to prevent eavesdropping secrets, tokens, and other sensitive information - Disabling authentication and/or authorization is **strongly discouraged** (but it's possible to do it, e.g. for learning / troubleshooting purposes) .debug[[k8s/control-plane-auth.md](https://github.com/BretFisher/kubernetes-mastery/tree/mastery/slides/k8s/control-plane-auth.md)] --- ## Authentication and authorization - Authentication (checking "who you are") is done with mutual TLS (both the client and the server need to hold a valid certificate) - Authorization (checking "what you can do") is done in different ways - the API server implements a sophisticated permission logic (with RBAC) - some services will defer authorization to the API server (through webhooks) - some services require a certificate signed by a particular CA / sub-CA .debug[[k8s/control-plane-auth.md](https://github.com/BretFisher/kubernetes-mastery/tree/mastery/slides/k8s/control-plane-auth.md)] --- ## In practice - We will review the various communication channels in the control plane - We will describe how they are secured - When TLS certificates are used, we will indicate: - which CA signs them - what their subject (CN) should be, when applicable - We will indicate how to configure security (client- and server-side) .debug[[k8s/control-plane-auth.md](https://github.com/BretFisher/kubernetes-mastery/tree/mastery/slides/k8s/control-plane-auth.md)] --- ## etcd peers - Replication and coordination of etcd happens on a dedicated port (typically port 2380; the default port for normal client connections is 2379) - Authentication uses TLS certificates with a separate sub-CA (otherwise, anyone with a Kubernetes client certificate could access etcd!) - The etcd command line flags involved are: `--peer-client-cert-auth=true` to activate it `--peer-cert-file`, `--peer-key-file`, `--peer-trusted-ca-file` .debug[[k8s/control-plane-auth.md](https://github.com/BretFisher/kubernetes-mastery/tree/mastery/slides/k8s/control-plane-auth.md)] --- ## etcd clients - The only¹ thing that connects to etcd is the API server - Authentication uses TLS certificates with a separate sub-CA (for the same reasons as for etcd inter-peer authentication) - The etcd command line flags involved are: `--client-cert-auth=true` to activate it `--trusted-ca-file`, `--cert-file`, `--key-file` - The API server command line flags involved are: `--etcd-cafile`, `--etcd-certfile`, `--etcd-keyfile` .footnote[¹Technically, there is also the etcd healthcheck. Let's ignore it for now.] .debug[[k8s/control-plane-auth.md](https://github.com/BretFisher/kubernetes-mastery/tree/mastery/slides/k8s/control-plane-auth.md)] --- ## API server clients - The API server has a sophisticated authentication and authorization system - For connections coming from other components of the control plane: - authentication uses certificates (trusting the certificates' subject or CN) - authorization uses whatever mechanism is enabled (most oftentimes, RBAC) - The relevant API server flags are: `--client-ca-file`, `--tls-cert-file`, `--tls-private-key-file` - Each component connecting to the API server takes a `--kubeconfig` flag (to specify a kubeconfig file containing the CA cert, client key, and client cert) - Yes, that kubeconfig file follows the same format as our `~/.kube/config` file! .debug[[k8s/control-plane-auth.md](https://github.com/BretFisher/kubernetes-mastery/tree/mastery/slides/k8s/control-plane-auth.md)] --- ## Kubelet and API server - Communication between kubelet and API server can be established both ways - Kubelet → API server: - kubelet registers itself ("hi, I'm node42, do you have work for me?") - connection is kept open and re-established if it breaks - that's how the kubelet knows which pods to start/stop - API server → kubelet: - used to retrieve logs, exec, attach to containers .debug[[k8s/control-plane-auth.md](https://github.com/BretFisher/kubernetes-mastery/tree/mastery/slides/k8s/control-plane-auth.md)] --- ## Kubelet → API server - Kubelet is started with `--kubeconfig` with API server information - The client certificate of the kubelet will typically have: `CN=system:node:<nodename>` and groups `O=system:nodes` - Nothing special on the API server side (it will authenticate like any other client) .debug[[k8s/control-plane-auth.md](https://github.com/BretFisher/kubernetes-mastery/tree/mastery/slides/k8s/control-plane-auth.md)] --- ## API server → kubelet - Kubelet is started with the flag `--client-ca-file` (typically using the same CA as the API server) - API server will use a dedicated key pair when contacting kubelet (specified with `--kubelet-client-certificate` and `--kubelet-client-key`) - Authorization uses webhooks (enabled with `--authorization-mode=Webhook` on kubelet) - The webhook server is the API server itself (the kubelet sends back a request to the API server to ask, "can this person do that?") .debug[[k8s/control-plane-auth.md](https://github.com/BretFisher/kubernetes-mastery/tree/mastery/slides/k8s/control-plane-auth.md)] --- ## Scheduler - The scheduler connects to the API server like an ordinary client - The certificate of the scheduler will have `CN=system:kube-scheduler` .debug[[k8s/control-plane-auth.md](https://github.com/BretFisher/kubernetes-mastery/tree/mastery/slides/k8s/control-plane-auth.md)] --- ## Controller manager - The controller manager is also a normal client to the API server - Its certificate will have `CN=system:kube-controller-manager` - If we use the CSR API, the controller manager needs the CA cert and key (passed with flags `--cluster-signing-cert-file` and `--cluster-signing-key-file`) - We usually want the controller manager to generate tokens for service accounts - These tokens deserve some details (on the next slide!) .debug[[k8s/control-plane-auth.md](https://github.com/BretFisher/kubernetes-mastery/tree/mastery/slides/k8s/control-plane-auth.md)] --- ## Service account tokens - Each time we create a service account, the controller manager generates a token - These tokens are JWT tokens, signed with a particular key - These tokens are used for authentication with the API server (and therefore, the API server needs to be able to verify their integrity) - This uses another keypair: - the private key (used for signature) is passed to the controller manager <br/>(using flags `--service-account-private-key-file` and `--root-ca-file`) - the public key (used for verification) is passed to the API server <br/>(using flag `--service-account-key-file`) .debug[[k8s/control-plane-auth.md](https://github.com/BretFisher/kubernetes-mastery/tree/mastery/slides/k8s/control-plane-auth.md)] --- ## kube-proxy - kube-proxy is "yet another API server client" - In many clusters, it runs as a Daemon Set - In that case, it will have its own Service Account and associated permissions - It will authenticate using the token of that Service Account .debug[[k8s/control-plane-auth.md](https://github.com/BretFisher/kubernetes-mastery/tree/mastery/slides/k8s/control-plane-auth.md)] --- ## Webhooks - We mentioned webhooks earlier; how does that really work? - The Kubernetes API has special resource types to check permissions - One of them is SubjectAccessReview - To check if a particular user can do a particular action on a particular resource: - we prepare a SubjectAccessReview object - we send that object to the API server - the API server responds with allow/deny (and optional explanations) - Using webhooks for authorization = sending SAR to authorize each request .debug[[k8s/control-plane-auth.md](https://github.com/BretFisher/kubernetes-mastery/tree/mastery/slides/k8s/control-plane-auth.md)] --- ## Subject Access Review Here is an example showing how to check if `jean.doe` can `get` some `pods` in `kube-system`: ```bash kubectl -v9 create -f- <<EOF apiVersion: authorization.k8s.io/v1beta1 kind: SubjectAccessReview spec: user: jean.doe group: - foo - bar resourceAttributes: #group: blah.k8s.io namespace: kube-system resource: pods verb: get #name: web-xyz1234567-pqr89 EOF ``` .debug[[k8s/control-plane-auth.md](https://github.com/BretFisher/kubernetes-mastery/tree/mastery/slides/k8s/control-plane-auth.md)] --- class: pic .interstitial[] --- name: toc-volumes class: title Volumes .nav[ [Previous section](#toc-securing-the-control-plane) | [Back to table of contents](#toc-chapter-9) | [Next section](#toc-building-images-with-the-docker-engine) ] .debug[(automatically generated title slide)] --- # Volumes - Volumes are special directories that are mounted in containers -- - Volumes can have many different purposes: - share files and directories between containers running on the same machine -- - share files and directories between containers and their host -- - centralize configuration information in Kubernetes and expose it to containers -- - manage credentials and secrets and expose them securely to containers - access storage systems (like Ceph, EBS, NFS, Portworx, and many others) .debug[[k8s/volumes.md](https://github.com/BretFisher/kubernetes-mastery/tree/mastery/slides/k8s/volumes.md)] --- class: extra-details ## Kubernetes volumes vs. Docker volumes - Kubernetes and Docker volumes are very similar (the [Kubernetes documentation](https://kubernetes.io/docs/concepts/storage/volumes/) says otherwise ... <br/> but it refers to Docker 1.7, which was released in 2015!) -- - Docker volumes allow us to share data between containers running on the same host -- - Kubernetes volumes allow us to share data between containers in the same pod -- - Both Docker and Kubernetes volumes enable access to storage systems -- - Kubernetes volumes can also be used to expose configuration and secrets -- - Docker has specific concepts for configuration and secrets <br/> (but under the hood, the technical implementation is similar) .debug[[k8s/volumes.md](https://github.com/BretFisher/kubernetes-mastery/tree/mastery/slides/k8s/volumes.md)] --- ## Volumes ≠ Persistent Volumes - Volumes and Persistent Volumes are related, but very different! -- - *Volumes*: - appear in Pod specifications (we'll see that in a few slides) - do not exist as API resources (**cannot** do `kubectl get volumes`) -- - *Persistent Volumes*: - are API resources (**can** do `kubectl get persistentvolumes`) - correspond to concrete volumes (e.g. on a SAN, EBS, etc.) - cannot be associated with a Pod directly <br/> (they need a Persistent Volume Claim) .debug[[k8s/volumes.md](https://github.com/BretFisher/kubernetes-mastery/tree/mastery/slides/k8s/volumes.md)] --- ## Adding a volume to a Pod - We will start with the simplest Pod manifest we can find -- - We will add a volume to that Pod manifest -- - We will mount that volume in a container in the Pod -- - By default, this volume will be an `emptyDir` (an empty directory) -- - It will hide ("shadow") the image directory where it's mounted .debug[[k8s/volumes.md](https://github.com/BretFisher/kubernetes-mastery/tree/mastery/slides/k8s/volumes.md)] --- ## Our basic Pod ```yaml apiVersion: v1 kind: Pod metadata: name: nginx-without-volume spec: containers: - name: nginx image: nginx ``` This is a MVP! (Minimum Viable Pod😉) It runs a single NGINX container. .debug[[k8s/volumes.md](https://github.com/BretFisher/kubernetes-mastery/tree/mastery/slides/k8s/volumes.md)] --- ## Trying the basic pod .exercise[ - Create the Pod: ```bash kubectl create -f https://k8smastery.com/nginx-1-without-volume.yaml ``` <!-- ```bash kubectl wait pod/nginx-without-volume --for condition=ready ``` --> - Get its IP address: ```bash IPADDR=$(kubectl get pod nginx-without-volume -o jsonpath={.status.podIP}) ``` - Send a request with curl: ```bash curl $IPADDR ``` ] (We should see the "Welcome to NGINX" page.) .debug[[k8s/volumes.md](https://github.com/BretFisher/kubernetes-mastery/tree/mastery/slides/k8s/volumes.md)] --- ## Adding a volume - We need to add the volume in two places: - at the Pod level (to declare the volume) - at the container level (to mount the volume) - We will declare a volume named `www` - No type is specified, so it will default to `emptyDir` (as the name implies, it will be initialized as an empty directory at pod creation) - In that pod, there is also a container named `nginx` - That container mounts the volume `www` to path `/usr/share/nginx/html/` .debug[[k8s/volumes.md](https://github.com/BretFisher/kubernetes-mastery/tree/mastery/slides/k8s/volumes.md)] --- ## The Pod with a volume ```yaml apiVersion: v1 kind: Pod metadata: name: nginx-with-volume spec: volumes: - name: www containers: - name: nginx image: nginx volumeMounts: - name: www mountPath: /usr/share/nginx/html/ ``` .debug[[k8s/volumes.md](https://github.com/BretFisher/kubernetes-mastery/tree/mastery/slides/k8s/volumes.md)] --- ## Trying the Pod with a volume .exercise[ - Create the Pod: ```bash kubectl create -f https://k8smastery.com/nginx-2-with-volume.yaml ``` <!-- ```bash kubectl wait pod/nginx-with-volume --for condition=ready ``` --> - Get its IP address: ```bash IPADDR=$(kubectl get pod nginx-with-volume -o jsonpath={.status.podIP}) ``` - Send a request with curl: ```bash curl $IPADDR ``` ] (We should now see a "403 Forbidden" error page.) .debug[[k8s/volumes.md](https://github.com/BretFisher/kubernetes-mastery/tree/mastery/slides/k8s/volumes.md)] --- ## Populating the volume with another container - Let's add another container to the Pod - Let's mount the volume in *both* containers - That container will populate the volume with static files - NGINX will then serve these static files - To populate the volume, we will clone the Spoon-Knife repository - this repository is https://github.com/octocat/Spoon-Knife - it's very popular (more than 100K forks!) .debug[[k8s/volumes.md](https://github.com/BretFisher/kubernetes-mastery/tree/mastery/slides/k8s/volumes.md)] --- ## Sharing a volume between two containers .small[ ```yaml apiVersion: v1 kind: Pod metadata: name: nginx-with-git spec: volumes: - name: www containers: - name: nginx image: nginx volumeMounts: - name: www mountPath: /usr/share/nginx/html/ - name: git image: alpine command: [ "sh", "-c", "apk add git && git clone https://github.com/octocat/Spoon-Knife /www" ] volumeMounts: - name: www mountPath: /www/ restartPolicy: OnFailure ``` ] .debug[[k8s/volumes.md](https://github.com/BretFisher/kubernetes-mastery/tree/mastery/slides/k8s/volumes.md)] --- ## Sharing a volume, explained - We added another container to the pod - That container mounts the `www` volume on a different path (`/www`) - It uses the `alpine` image - When started, it installs `git` and clones the `octocat/Spoon-Knife` repository (that repository contains a tiny HTML website) - As a result, NGINX now serves this website .debug[[k8s/volumes.md](https://github.com/BretFisher/kubernetes-mastery/tree/mastery/slides/k8s/volumes.md)] --- ## Trying the shared volume - This one will be time-sensitive! - We need to catch the Pod IP address *as soon as it's created* - Then send a request to it *as fast as possible* .exercise[ - Watch the pods (so that we can catch the Pod IP address) ```bash kubectl get pods -o wide --watch ``` <!-- ```wait NAME``` ```tmux split-pane -v``` --> ] .debug[[k8s/volumes.md](https://github.com/BretFisher/kubernetes-mastery/tree/mastery/slides/k8s/volumes.md)] --- ## Shared volume in action .exercise[ - Create the pod: ```bash kubectl create -f https://k8smastery.com/nginx-3-with-git.yaml ``` <!-- ```bash kubectl wait pod/nginx-with-git --for condition=initialized``` ```bash IP=$(kubectl get pod nginx-with-git -o jsonpath={.status.podIP})``` --> - As soon as we see its IP address, access it: ```bash curl `$IP` ``` <!-- ```bash /bin/sleep 5``` --> - A few seconds later, the state of the pod will change; access it again: ```bash curl `$IP` ``` ] The first time, we should see "403 Forbidden". The second time, we should see the HTML file from the Spoon-Knife repository. .debug[[k8s/volumes.md](https://github.com/BretFisher/kubernetes-mastery/tree/mastery/slides/k8s/volumes.md)] --- ## Explanations - Both containers are started at the same time - NGINX starts very quickly (it can serve requests immediately) - But at this point, the volume is empty (NGINX serves "403 Forbidden") - The other containers installs git and clones the repository (this takes a bit longer) - When the other container is done, the volume holds the repository (NGINX serves the HTML file) .debug[[k8s/volumes.md](https://github.com/BretFisher/kubernetes-mastery/tree/mastery/slides/k8s/volumes.md)] --- ## The devil is in the details - The default `restartPolicy` is `Always` - This would cause our `git` container to run again ... and again ... and again (with an exponential back-off delay, as explained [in the documentation](https://kubernetes.io/docs/concepts/workloads/pods/pod-lifecycle/#restart-policy)) - That's why we specified `restartPolicy: OnFailure` .debug[[k8s/volumes.md](https://github.com/BretFisher/kubernetes-mastery/tree/mastery/slides/k8s/volumes.md)] --- ## Inconsistencies - There is a short period of time during which the website is not available (because the `git` container hasn't done its job yet) - With a bigger website, we could get inconsistent results (where only a part of the content is ready) - In real applications, this could cause incorrect results - How can we avoid that? .debug[[k8s/volumes.md](https://github.com/BretFisher/kubernetes-mastery/tree/mastery/slides/k8s/volumes.md)] --- ## Init Containers - We can define containers that should execute *before* the main ones - They will be executed in order (instead of in parallel) - They must all succeed before the main containers are started - This is *exactly* what we need here! - Let's see one in action .footnote[See [Init Containers](https://kubernetes.io/docs/concepts/workloads/pods/init-containers/) documentation for all the details.] .debug[[k8s/volumes.md](https://github.com/BretFisher/kubernetes-mastery/tree/mastery/slides/k8s/volumes.md)] --- ## Defining Init Containers .small[ ```yaml apiVersion: v1 kind: Pod metadata: name: nginx-with-init spec: volumes: - name: www containers: - name: nginx image: nginx volumeMounts: - name: www mountPath: /usr/share/nginx/html/ initContainers: - name: git image: alpine command: [ "sh", "-c", "apk add --no-cache git && git clone https://github.com/octocat/Spoon-Knife /www" ] volumeMounts: - name: www mountPath: /www/ ``` ] .debug[[k8s/volumes.md](https://github.com/BretFisher/kubernetes-mastery/tree/mastery/slides/k8s/volumes.md)] --- ## Trying the init container .exercise[ - Repeat the same operation as earlier (try to send HTTP requests as soon as the pod comes up) <!-- ```key ^D``` ```key ^C``` --> ] - This time, instead of "403 Forbidden" we get a "connection refused" - NGINX doesn't start until the git container has done its job - We never get inconsistent results (a "half-ready" container) .debug[[k8s/volumes.md](https://github.com/BretFisher/kubernetes-mastery/tree/mastery/slides/k8s/volumes.md)] --- ## Other uses of init containers - Load content - Generate configuration (or certificates) - Database migrations - Waiting for other services to be up (to avoid flurry of connection errors in main container) - etc. .debug[[k8s/volumes.md](https://github.com/BretFisher/kubernetes-mastery/tree/mastery/slides/k8s/volumes.md)] --- ## Volume lifecycle - The lifecycle of a volume is linked to the pod's lifecycle - This means that a volume is created when the pod is created - This is mostly relevant for `emptyDir` volumes (other volumes, like remote storage, are not "created" but rather "attached" ) - A volume survives across container restarts - A volume is destroyed (or, for remote storage, detached) when the pod is destroyed .debug[[k8s/volumes.md](https://github.com/BretFisher/kubernetes-mastery/tree/mastery/slides/k8s/volumes.md)] --- class: pic .interstitial[] --- name: toc-building-images-with-the-docker-engine class: title Building images with the Docker Engine .nav[ [Previous section](#toc-volumes) | [Back to table of contents](#toc-chapter-9) | [Next section](#toc-building-images-with-kaniko) ] .debug[(automatically generated title slide)] --- # Building images with the Docker Engine - Until now, we have built our images manually, directly on a node - We are going to show how to build images from within the cluster (by executing code in a container controlled by Kubernetes) - We are going to use the Docker Engine for that purpose - To access the Docker Engine, we will mount the Docker socket in our container - After building the image, we will push it to our self-hosted registry .debug[[k8s/build-with-docker.md](https://github.com/BretFisher/kubernetes-mastery/tree/mastery/slides/k8s/build-with-docker.md)] --- ## Resource specification for our builder pod .small[ ```yaml apiVersion: v1 kind: Pod metadata: name: build-image spec: restartPolicy: OnFailure containers: - name: docker-build image: docker env: - name: REGISTRY_PORT value: "`3XXXX`" command: ["sh", "-c"] args: - | apk add --no-cache git && mkdir /workspace && git clone https://github.com/jpetazzo/container.training /workspace && docker build -t localhost:$REGISTRY_PORT/worker /workspace/dockercoins/worker && docker push localhost:$REGISTRY_PORT/worker volumeMounts: - name: docker-socket mountPath: /var/run/docker.sock volumes: - name: docker-socket hostPath: path: /var/run/docker.sock ``` ] .debug[[k8s/build-with-docker.md](https://github.com/BretFisher/kubernetes-mastery/tree/mastery/slides/k8s/build-with-docker.md)] --- ## Breaking down the pod specification (1/2) - `restartPolicy: OnFailure` prevents the build from running in an infinite lopo - We use the `docker` image (so that the `docker` CLI is available) - We rely on the fact that the `docker` image is based on `alpine` (which is why we use `apk` to install `git`) - The port for the registry is passed through an environment variable (this avoids repeating it in the specification, which would be error-prone) .warning[The environment variable has to be a string, so the `"`s are mandatory!] .debug[[k8s/build-with-docker.md](https://github.com/BretFisher/kubernetes-mastery/tree/mastery/slides/k8s/build-with-docker.md)] --- ## Breaking down the pod specification (2/2) - The volume `docker-socket` is declared with a `hostPath`, indicating a bind-mount - It is then mounted in the container onto the default Docker socket path - We show a interesting way to specify the commands to run in the container: - the command executed will be `sh -c <args>` - `args` is a list of strings - `|` is used to pass a multi-line string in the YAML file .debug[[k8s/build-with-docker.md](https://github.com/BretFisher/kubernetes-mastery/tree/mastery/slides/k8s/build-with-docker.md)] --- ## Running our pod - Let's try this out! .exercise[ - Check the port used by our self-hosted registry: ```bash kubectl get svc registry ``` - Edit `~/container.training/k8s/docker-build.yaml` to put the port number - Schedule the pod by applying the resource file: ```bash kubectl apply -f ~/container.training/k8s/docker-build.yaml ``` - Watch the logs: ```bash stern build-image ``` <!-- ```longwait latest: digest: sha256:``` ```key ^C``` --> ] .debug[[k8s/build-with-docker.md](https://github.com/BretFisher/kubernetes-mastery/tree/mastery/slides/k8s/build-with-docker.md)] --- ## What's missing? What do we need to change to make this production-ready? - Build from a long-running container (e.g. a `Deployment`) triggered by web hooks (the payload of the web hook could indicate the repository to build) - Build a specific branch or tag; tag image accordingly - Handle repositories where the Dockerfile is not at the root (or containing multiple Dockerfiles) - Expose build logs so that troubleshooting is straightforward -- 🤔 That seems like a lot of work! -- That's why services like Docker Hub (with [automated builds](https://docs.docker.com/docker-hub/builds/)) are helpful. <br/> They handle the whole "code repository → Docker image" workflow. .debug[[k8s/build-with-docker.md](https://github.com/BretFisher/kubernetes-mastery/tree/mastery/slides/k8s/build-with-docker.md)] --- ## Things to be aware of - This is talking directly to a node's Docker Engine to build images - It bypasses resource allocation mechanisms used by Kubernetes (but you can use *taints* and *tolerations* to dedicate builder nodes) - Be careful not to introduce conflicts when naming images (e.g. do not allow the user to specify the image names!) - Your builds are going to be *fast* (because they will leverage Docker's caching system) .debug[[k8s/build-with-docker.md](https://github.com/BretFisher/kubernetes-mastery/tree/mastery/slides/k8s/build-with-docker.md)] --- class: pic .interstitial[] --- name: toc-building-images-with-kaniko class: title Building images with Kaniko .nav[ [Previous section](#toc-building-images-with-the-docker-engine) | [Back to table of contents](#toc-chapter-9) | [Next section](#toc-managing-configuration) ] .debug[(automatically generated title slide)] --- # Building images with Kaniko - [Kaniko](https://github.com/GoogleContainerTools/kaniko) is an open source tool to build container images within Kubernetes - It can build an image using any standard Dockerfile - The resulting image can be pushed to a registry or exported as a tarball - It doesn't require any particular privilege (and can therefore run in a regular container in a regular pod) - This combination of features is pretty unique (most other tools use different formats, or require elevated privileges) .debug[[k8s/build-with-kaniko.md](https://github.com/BretFisher/kubernetes-mastery/tree/mastery/slides/k8s/build-with-kaniko.md)] --- ## Kaniko in practice - Kaniko provides an "executor image", `gcr.io/kaniko-project/executor` - When running that image, we need to specify at least: - the path to the build context (=the directory with our Dockerfile) - the target image name (including the registry address) - Simplified example: ``` docker run \ -v ...:/workspace gcr.io/kaniko-project/executor \ --context=/workspace \ --destination=registry:5000/image_name:image_tag ``` .debug[[k8s/build-with-kaniko.md](https://github.com/BretFisher/kubernetes-mastery/tree/mastery/slides/k8s/build-with-kaniko.md)] --- ## Running Kaniko in a Docker container - Let's build the image for the DockerCoins `worker` service with Kaniko .exercise[ - Find the port number for our self-hosted registry: ```bash kubectl get svc registry PORT=$(kubectl get svc registry -o json | jq .spec.ports[0].nodePort) ``` - Run Kaniko: ```bash docker run --net host \ -v ~/container.training/dockercoins/worker:/workspace \ gcr.io/kaniko-project/executor \ --context=/workspace \ --destination=127.0.0.1:$PORT/worker-kaniko:latest ``` ] We use `--net host` so that we can connect to the registry over `127.0.0.1`. .debug[[k8s/build-with-kaniko.md](https://github.com/BretFisher/kubernetes-mastery/tree/mastery/slides/k8s/build-with-kaniko.md)] --- ## Running Kaniko in a Kubernetes pod - We need to mount or copy the build context to the pod - We are going to build straight from the git repository (to avoid depending on files sitting on a node, outside of containers) - We need to `git clone` the repository before running Kaniko - We are going to use two containers sharing a volume: - a first container to `git clone` the repository to the volume - a second container to run Kaniko, using the content of the volume - However, we need the first container to be done before running the second one 🤔 How could we do that? .debug[[k8s/build-with-kaniko.md](https://github.com/BretFisher/kubernetes-mastery/tree/mastery/slides/k8s/build-with-kaniko.md)] --- ## [Init Containers](https://kubernetes.io/docs/concepts/workloads/pods/init-containers/) to the rescue - A pod can have a list of `initContainers` - `initContainers` are executed in the specified order - Each Init Container needs to complete (exit) successfully - If any Init Container fails (non-zero exit status) the pod fails (what happens next depends on the pod's `restartPolicy`) - After all Init Containers have run successfully, normal `containers` are started - We are going to execute the `git clone` operation in an Init Container .debug[[k8s/build-with-kaniko.md](https://github.com/BretFisher/kubernetes-mastery/tree/mastery/slides/k8s/build-with-kaniko.md)] --- ## Our Kaniko builder pod .small[ ```yaml apiVersion: v1 kind: Pod metadata: name: kaniko-build spec: initContainers: - name: git-clone image: alpine command: ["sh", "-c"] args: - | apk add --no-cache git && git clone git://github.com/jpetazzo/container.training /workspace volumeMounts: - name: workspace mountPath: /workspace containers: - name: build-image image: gcr.io/kaniko-project/executor:latest args: - "--context=/workspace/dockercoins/rng" - "--insecure" - "--destination=registry:5000/rng-kaniko:latest" volumeMounts: - name: workspace mountPath: /workspace volumes: - name: workspace ``` ] .debug[[k8s/build-with-kaniko.md](https://github.com/BretFisher/kubernetes-mastery/tree/mastery/slides/k8s/build-with-kaniko.md)] --- ## Explanations - We define a volume named `workspace` (using the default `emptyDir` provider) - That volume is mounted to `/workspace` in both our containers - The `git-clone` Init Container installs `git` and runs `git clone` - The `build-image` container executes Kaniko - We use our self-hosted registry DNS name (`registry`) - We add `--insecure` to use plain HTTP to talk to the registry .debug[[k8s/build-with-kaniko.md](https://github.com/BretFisher/kubernetes-mastery/tree/mastery/slides/k8s/build-with-kaniko.md)] --- ## Running our Kaniko builder pod - The YAML for the pod is in `k8s/kaniko-build.yaml` .exercise[ - Create the pod: ```bash kubectl apply -f ~/container.training/k8s/kaniko-build.yaml ``` - Watch the logs: ```bash stern kaniko ``` <!-- ```longwait registry:5000/rng-kaniko:latest:``` ```key ^C``` --> ] .debug[[k8s/build-with-kaniko.md](https://github.com/BretFisher/kubernetes-mastery/tree/mastery/slides/k8s/build-with-kaniko.md)] --- ## Discussion *What should we use? The Docker build technique shown earlier? Kaniko? Something else?* - The Docker build technique is simple, and has the potential to be very fast - However, it doesn't play nice with Kubernetes resource limits - Kaniko plays nice with resource limits - However, it's slower (there is no caching at all) - The ultimate building tool will probably be [Jessica Frazelle](https://twitter.com/jessfraz)'s [img](https://github.com/genuinetools/img) builder (it depends on upstream changes that are not in Kubernetes 1.11.2 yet) But ... is it all about [speed](https://github.com/AkihiroSuda/buildbench/issues/1)? (No!) .debug[[k8s/build-with-kaniko.md](https://github.com/BretFisher/kubernetes-mastery/tree/mastery/slides/k8s/build-with-kaniko.md)] --- ## The big picture - For starters: the [Docker Hub automated builds](https://docs.docker.com/docker-hub/builds/) are very easy to set up - link a GitHub repository with the Docker Hub - each time you push to GitHub, an image gets build on the Docker Hub - If this doesn't work for you: why? - too slow (I'm far from `us-east-1`!) → consider using your cloud provider's registry - I'm not using a cloud provider → ok, perhaps you need to self-host then - I need fancy features (e.g. CI) → consider something like GitLab .debug[[k8s/build-with-kaniko.md](https://github.com/BretFisher/kubernetes-mastery/tree/mastery/slides/k8s/build-with-kaniko.md)] --- class: pic .interstitial[] --- name: toc-managing-configuration class: title Managing configuration .nav[ [Previous section](#toc-building-images-with-kaniko) | [Back to table of contents](#toc-chapter-10) | [Next section](#toc-stateful-sets) ] .debug[(automatically generated title slide)] --- # Managing configuration - Some applications need to be configured (obviously!) - There are many ways for our code to pick up configuration: - command-line arguments - environment variables - configuration files - configuration servers (getting configuration from a database, an API...) - ... and more (because programmers can be very creative!) - How can we do these things with containers and Kubernetes? .debug[[k8s/configuration.md](https://github.com/BretFisher/kubernetes-mastery/tree/mastery/slides/k8s/configuration.md)] --- ## Passing configuration to containers - There are many ways to pass configuration to code running in a container: - baking it into a custom image - command-line arguments - environment variables - injecting configuration files - exposing it over the Kubernetes API - configuration servers - Let's review these different strategies! .debug[[k8s/configuration.md](https://github.com/BretFisher/kubernetes-mastery/tree/mastery/slides/k8s/configuration.md)] --- ## Baking custom images - Put the configuration in the image (it can be in a configuration file, but also `ENV` or `CMD` actions) - It's easy! It's simple! - Unfortunately, it also has downsides: - multiplication of images - different images for dev, staging, prod ... - minor reconfigurations require a whole build/push/pull cycle - Avoid doing it unless you don't have the time to figure out other options .debug[[k8s/configuration.md](https://github.com/BretFisher/kubernetes-mastery/tree/mastery/slides/k8s/configuration.md)] --- ## Command-line arguments - Pass options to `args` array in the container specification - Example ([source](https://github.com/coreos/pods/blob/master/kubernetes.yaml#L29)): ```yaml args: - "--data-dir=/var/lib/etcd" - "--advertise-client-urls=http://127.0.0.1:2379" - "--listen-client-urls=http://127.0.0.1:2379" - "--listen-peer-urls=http://127.0.0.1:2380" - "--name=etcd" ``` - The options can be passed directly to the program that we run ... ... or to a wrapper script that will use them to e.g. generate a config file .debug[[k8s/configuration.md](https://github.com/BretFisher/kubernetes-mastery/tree/mastery/slides/k8s/configuration.md)] --- ## Command-line arguments, pros & cons - Works great when options are passed directly to the running program (otherwise, a wrapper script can work around the issue) - Works great when there aren't too many parameters (to avoid a 20-lines `args` array) - Requires documentation and/or understanding of the underlying program ("which parameters and flags do I need, again?") - Well-suited for mandatory parameters (without default values) - Not ideal when we need to pass a real configuration file anyway .debug[[k8s/configuration.md](https://github.com/BretFisher/kubernetes-mastery/tree/mastery/slides/k8s/configuration.md)] --- ## Environment variables - Pass options through the `env` map in the container specification - Example: ```yaml env: - name: ADMIN_PORT value: "8080" - name: ADMIN_AUTH value: Basic - name: ADMIN_CRED value: "admin:0pensesame!" ``` .warning[`value` must be a string! Make sure that numbers and fancy strings are quoted.] 🤔 Why this weird `{name: xxx, value: yyy}` scheme? It will be revealed soon! .debug[[k8s/configuration.md](https://github.com/BretFisher/kubernetes-mastery/tree/mastery/slides/k8s/configuration.md)] --- ## The Downward API - In the previous example, environment variables have fixed values - We can also use a mechanism called the *Downward API* - The Downward API allows exposing pod or container information - either through special files (we won't show that for now) - or through environment variables - The value of these environment variables is computed when the container is started - Remember: environment variables won't (can't) change after container start - Let's see a few concrete examples! .debug[[k8s/configuration.md](https://github.com/BretFisher/kubernetes-mastery/tree/mastery/slides/k8s/configuration.md)] --- ## Exposing the pod's namespace ```yaml - name: MY_POD_NAMESPACE valueFrom: fieldRef: fieldPath: metadata.namespace ``` - Useful to generate FQDN of services (in some contexts, a short name is not enough) - For instance, the two commands should be equivalent: ``` curl api-backend curl api-backend.$MY_POD_NAMESPACE.svc.cluster.local ``` .debug[[k8s/configuration.md](https://github.com/BretFisher/kubernetes-mastery/tree/mastery/slides/k8s/configuration.md)] --- ## Exposing the pod's IP address ```yaml - name: MY_POD_IP valueFrom: fieldRef: fieldPath: status.podIP ``` - Useful if we need to know our IP address (we could also read it from `eth0`, but this is more solid) .debug[[k8s/configuration.md](https://github.com/BretFisher/kubernetes-mastery/tree/mastery/slides/k8s/configuration.md)] --- ## Exposing the container's resource limits ```yaml - name: MY_MEM_LIMIT valueFrom: resourceFieldRef: containerName: test-container resource: limits.memory ``` - Useful for runtimes where memory is garbage collected - Example: the JVM (the memory available to the JVM should be set with the `-Xmx ` flag) - Best practice: set a memory limit, and pass it to the runtime - Note: recent versions of the JVM can do this automatically (see [JDK-8146115](https://bugs.java.com/bugdatabase/view_bug.do?bug_id=JDK-8146115)) and [this blog post](https://very-serio.us/2017/12/05/running-jvms-in-kubernetes/) for detailed examples) .debug[[k8s/configuration.md](https://github.com/BretFisher/kubernetes-mastery/tree/mastery/slides/k8s/configuration.md)] --- ## More about the Downward API - [This documentation page](https://kubernetes.io/docs/tasks/inject-data-application/environment-variable-expose-pod-information/) tells more about these environment variables - And [this one](https://kubernetes.io/docs/tasks/inject-data-application/downward-api-volume-expose-pod-information/) explains the other way to use the Downward API (through files that get created in the container filesystem) .debug[[k8s/configuration.md](https://github.com/BretFisher/kubernetes-mastery/tree/mastery/slides/k8s/configuration.md)] --- ## Environment variables, pros and cons - Works great when the running program expects these variables - Works great for optional parameters with reasonable defaults (since the container image can provide these defaults) - Sort of auto-documented (we can see which environment variables are defined in the image, and their values) - Can be (ab)used with longer values ... - ... You *can* put an entire Tomcat configuration file in an environment ... - ... But *should* you? (Do it if you really need to, we're not judging! But we'll see better ways.) .debug[[k8s/configuration.md](https://github.com/BretFisher/kubernetes-mastery/tree/mastery/slides/k8s/configuration.md)] --- ## Injecting configuration files with ConfigMaps - Sometimes, there is no way around it: we need to inject a full config file - Kubernetes provides a mechanism for that purpose: `ConfigMaps` - A ConfigMap is a Kubernetes resource that exists in a namespace - Conceptually, it's a key/value map (values are arbitrary strings) - We can think about them in (at least) two different ways: - as holding entire configuration file(s) - as holding individual configuration parameters *Note: to hold sensitive information, we can use "Secrets", which are another type of resource behaving very much like ConfigMaps. We'll cover them just after!* .debug[[k8s/configuration.md](https://github.com/BretFisher/kubernetes-mastery/tree/mastery/slides/k8s/configuration.md)] --- ## ConfigMaps storing entire files - In this case, each key/value pair corresponds to a configuration file - Key = name of the file - Value = content of the file - There can be one key/value pair, or as many as necessary (for complex apps with multiple configuration files) - Examples: ```bash # Create a ConfigMap with a single key, "app.conf" kubectl create configmap my-app-config --from-file=app.conf # Create a ConfigMap with a single key, "app.conf" but another file kubectl create configmap my-app-config --from-file=app.conf=app-prod.conf # Create a ConfigMap with multiple keys (one per file in the config.d directory) kubectl create configmap my-app-config --from-file=config.d/ ``` .debug[[k8s/configuration.md](https://github.com/BretFisher/kubernetes-mastery/tree/mastery/slides/k8s/configuration.md)] --- ## ConfigMaps storing individual parameters - In this case, each key/value pair corresponds to a parameter - Key = name of the parameter - Value = value of the parameter - Examples: ```bash # Create a ConfigMap with two keys kubectl create cm my-app-config \ --from-literal=foreground=red \ --from-literal=background=blue # Create a ConfigMap from a file containing key=val pairs kubectl create cm my-app-config \ --from-env-file=app.conf ``` .debug[[k8s/configuration.md](https://github.com/BretFisher/kubernetes-mastery/tree/mastery/slides/k8s/configuration.md)] --- ## Exposing ConfigMaps to containers - ConfigMaps can be exposed as plain files in the filesystem of a container - this is achieved by declaring a volume and mounting it in the container - this is particularly effective for ConfigMaps containing whole files - ConfigMaps can be exposed as environment variables in the container - this is achieved with the Downward API - this is particularly effective for ConfigMaps containing individual parameters - Let's see how to do both! .debug[[k8s/configuration.md](https://github.com/BretFisher/kubernetes-mastery/tree/mastery/slides/k8s/configuration.md)] --- ## Passing a configuration file with a ConfigMap - We will start a load balancer powered by HAProxy - We will use the [official `haproxy` image](https://hub.docker.com/_/haproxy/) - It expects to find its configuration in `/usr/local/etc/haproxy/haproxy.cfg` - We will provide a simple HAProxy configuration - It listens on port 80, and load balances connections between IBM and Google .debug[[k8s/configuration.md](https://github.com/BretFisher/kubernetes-mastery/tree/mastery/slides/k8s/configuration.md)] --- ## Creating the ConfigMap .exercise[ - Download our simple HAProxy config: ```bash curl -O https://k8smastery.com/haproxy.cfg ``` - Create a ConfigMap named `haproxy` and holding the configuration file: ```bash kubectl create configmap haproxy --from-file=haproxy.cfg ``` - Check what our ConfigMap looks like: ```bash kubectl get configmap haproxy -o yaml ``` ] .debug[[k8s/configuration.md](https://github.com/BretFisher/kubernetes-mastery/tree/mastery/slides/k8s/configuration.md)] --- ## Using the ConfigMap We are going to use the following pod definition: ```yaml apiVersion: v1 kind: Pod metadata: name: haproxy spec: volumes: - name: config configMap: name: haproxy containers: - name: haproxy image: haproxy volumeMounts: - name: config mountPath: /usr/local/etc/haproxy/ ``` .debug[[k8s/configuration.md](https://github.com/BretFisher/kubernetes-mastery/tree/mastery/slides/k8s/configuration.md)] --- ## Using the ConfigMap - Apply the resource definition from the previous slide .exercise[ - Create the HAProxy pod: ```bash kubectl apply -f https://k8smastery.com/haproxy.yaml ``` - Check the IP address allocated to the pod, inside [`shpod`](#shpod): ```bash kubectl attach --namespace=shpod -ti shpod kubectl get pod haproxy -o wide IP=$(kubectl get pod haproxy -o json | jq -r .status.podIP) ``` ] .debug[[k8s/configuration.md](https://github.com/BretFisher/kubernetes-mastery/tree/mastery/slides/k8s/configuration.md)] --- ## Testing our load balancer - The load balancer will send: - half of the connections to Google - the other half to IBM .exercise[ - Access the load balancer a few times: ```bash curl $IP curl $IP curl $IP ``` ] We should see connections served by Google, and others served by IBM. <br/> (Each server sends us a redirect page. Look at the URL that they send us to!) .debug[[k8s/configuration.md](https://github.com/BretFisher/kubernetes-mastery/tree/mastery/slides/k8s/configuration.md)] --- ## Exposing ConfigMaps with the Downward API - We are going to run a Docker registry on a custom port - By default, the registry listens on port 5000 - This can be changed by setting environment variable `REGISTRY_HTTP_ADDR` - We are going to store the port number in a ConfigMap - Then we will expose that ConfigMap as a container environment variable .debug[[k8s/configuration.md](https://github.com/BretFisher/kubernetes-mastery/tree/mastery/slides/k8s/configuration.md)] --- ## Creating the ConfigMap .exercise[ - Our ConfigMap will have a single key, `http.addr`: ```bash kubectl create configmap registry --from-literal=http.addr=0.0.0.0:80 ``` - Check our ConfigMap: ```bash kubectl get configmap registry -o yaml ``` ] .debug[[k8s/configuration.md](https://github.com/BretFisher/kubernetes-mastery/tree/mastery/slides/k8s/configuration.md)] --- ## Using the ConfigMap We are going to use the following pod definition: ```yaml apiVersion: v1 kind: Pod metadata: name: registry spec: containers: - name: registry image: registry env: - name: REGISTRY_HTTP_ADDR valueFrom: configMapKeyRef: name: registry key: http.addr ``` .debug[[k8s/configuration.md](https://github.com/BretFisher/kubernetes-mastery/tree/mastery/slides/k8s/configuration.md)] --- ## Using the ConfigMap - The resource definition from the previous slide: .exercise[ - Create the registry pod: ```bash kubectl apply -f https://k8smastery.com/registry.yaml ``` - Check the IP address allocated to the pod: ```bash kubectl attach --namespace=shpod -ti shpod kubectl get pod registry -o wide IP=$(kubectl get pod registry -o json | jq -r .status.podIP) ``` - Confirm that the registry is available on port 80: ```bash curl $IP/v2/_catalog ``` ] .debug[[k8s/configuration.md](https://github.com/BretFisher/kubernetes-mastery/tree/mastery/slides/k8s/configuration.md)] --- ## Passwords, tokens, sensitive information - For sensitive information, there is another special resource: *Secrets* - Secrets and Configmaps work almost the same way (we'll expose the differences on the next slide) - The *intent* is different, though: *"You should use secrets for things which are actually secret like API keys, credentials, etc., and use config map for not-secret configuration data."* *"In the future there will likely be some differentiators for secrets like rotation or support for backing the secret API w/ HSMs, etc."* (Source: [the author of both features](https://stackoverflow.com/a/36925553/580281 )) .debug[[k8s/configuration.md](https://github.com/BretFisher/kubernetes-mastery/tree/mastery/slides/k8s/configuration.md)] --- ## Differences between ConfigMaps and Secrets - Secrets are base64-encoded when shown with `kubectl get secrets -o yaml` - keep in mind that this is just *encoding*, not *encryption* - it is very easy to [automatically extract and decode secrets](https://medium.com/@mveritym/decoding-kubernetes-secrets-60deed7a96a3) - [Secrets can be encrypted at rest](https://kubernetes.io/docs/tasks/administer-cluster/encrypt-data/) - With RBAC, we can authorize a user to access ConfigMaps, but not Secrets (since they are two different kinds of resources) .debug[[k8s/configuration.md](https://github.com/BretFisher/kubernetes-mastery/tree/mastery/slides/k8s/configuration.md)] --- class: pic .interstitial[] --- name: toc-stateful-sets class: title Stateful sets .nav[ [Previous section](#toc-managing-configuration) | [Back to table of contents](#toc-chapter-10) | [Next section](#toc-running-a-consul-cluster) ] .debug[(automatically generated title slide)] --- # Stateful sets - Stateful sets are a type of resource in the Kubernetes API (like pods, deployments, services...) - They offer mechanisms to deploy scaled stateful applications - At a first glance, they look like *deployments*: - a stateful set defines a pod spec and a number of replicas *R* - it will make sure that *R* copies of the pod are running - that number can be changed while the stateful set is running - updating the pod spec will cause a rolling update to happen - But they also have some significant differences .debug[[k8s/statefulsets.md](https://github.com/BretFisher/kubernetes-mastery/tree/mastery/slides/k8s/statefulsets.md)] --- ## Stateful sets unique features - Pods in a stateful set are numbered (from 0 to *R-1*) and ordered - They are started and updated in order (from 0 to *R-1*) - A pod is started (or updated) only when the previous one is ready - They are stopped in reverse order (from *R-1* to 0) - Each pod know its identity (i.e. which number it is in the set) - Each pod can discover the IP address of the others easily - The pods can persist data on attached volumes 🤔 Wait a minute ... Can't we already attach volumes to pods and deployments? .debug[[k8s/statefulsets.md](https://github.com/BretFisher/kubernetes-mastery/tree/mastery/slides/k8s/statefulsets.md)] --- ## Revisiting volumes - [Volumes](https://kubernetes.io/docs/concepts/storage/volumes/) are used for many purposes: - sharing data between containers in a pod - exposing configuration information and secrets to containers - accessing storage systems - Let's see examples of the latter usage .debug[[k8s/statefulsets.md](https://github.com/BretFisher/kubernetes-mastery/tree/mastery/slides/k8s/statefulsets.md)] --- ## Volumes types - There are many [types of volumes](https://kubernetes.io/docs/concepts/storage/volumes/#types-of-volumes) available: - public cloud storage (GCEPersistentDisk, AWSElasticBlockStore, AzureDisk...) - private cloud storage (Cinder, VsphereVolume...) - traditional storage systems (NFS, iSCSI, FC...) - distributed storage (Ceph, Glusterfs, Portworx...) - Using a persistent volume requires: - creating the volume out-of-band (outside of the Kubernetes API) - referencing the volume in the pod description, with all its parameters .debug[[k8s/statefulsets.md](https://github.com/BretFisher/kubernetes-mastery/tree/mastery/slides/k8s/statefulsets.md)] --- ## Using a cloud volume Here is a pod definition using an AWS EBS volume (that has to be created first): ```yaml apiVersion: v1 kind: Pod metadata: name: pod-using-my-ebs-volume spec: containers: - image: ... name: container-using-my-ebs-volume volumeMounts: - mountPath: /my-ebs name: my-ebs-volume volumes: - name: my-ebs-volume awsElasticBlockStore: volumeID: vol-049df61146c4d7901 fsType: ext4 ``` .debug[[k8s/statefulsets.md](https://github.com/BretFisher/kubernetes-mastery/tree/mastery/slides/k8s/statefulsets.md)] --- ## Using an NFS volume Here is another example using a volume on an NFS server: ```yaml apiVersion: v1 kind: Pod metadata: name: pod-using-my-nfs-volume spec: containers: - image: ... name: container-using-my-nfs-volume volumeMounts: - mountPath: /my-nfs name: my-nfs-volume volumes: - name: my-nfs-volume nfs: server: 192.168.0.55 path: "/exports/assets" ``` .debug[[k8s/statefulsets.md](https://github.com/BretFisher/kubernetes-mastery/tree/mastery/slides/k8s/statefulsets.md)] --- ## Shortcomings of volumes - Their lifecycle (creation, deletion...) is managed outside of the Kubernetes API (we can't just use `kubectl apply/create/delete/...` to manage them) - If a Deployment uses a volume, all replicas end up using the same volume - That volume must then support concurrent access - some volumes do (e.g. NFS servers support multiple read/write access) - some volumes support concurrent reads - some volumes support concurrent access for colocated pods - What we really need is a way for each replica to have its own volume .debug[[k8s/statefulsets.md](https://github.com/BretFisher/kubernetes-mastery/tree/mastery/slides/k8s/statefulsets.md)] --- ## Individual volumes - The Pods of a Stateful set can have individual volumes (i.e. in a Stateful set with 3 replicas, there will be 3 volumes) - These volumes can be either: - allocated from a pool of pre-existing volumes (disks, partitions ...) - created dynamically using a storage system - This introduces a bunch of new Kubernetes resource types: Persistent Volumes, Persistent Volume Claims, Storage Classes (and also `volumeClaimTemplates`, that appear within Stateful Set manifests!) .debug[[k8s/statefulsets.md](https://github.com/BretFisher/kubernetes-mastery/tree/mastery/slides/k8s/statefulsets.md)] --- ## Stateful set recap - A Stateful sets manages a number of identical pods (like a Deployment) - These pods are numbered, and started/upgraded/stopped in a specific order - These pods are aware of their number (e.g., #0 can decide to be the primary, and #1 can be secondary) - These pods can find the IP addresses of the other pods in the set (through a *headless service*) - These pods can each have their own persistent storage (Deployments cannot do that) .debug[[k8s/statefulsets.md](https://github.com/BretFisher/kubernetes-mastery/tree/mastery/slides/k8s/statefulsets.md)] --- class: pic .interstitial[] --- name: toc-running-a-consul-cluster class: title Running a Consul cluster .nav[ [Previous section](#toc-stateful-sets) | [Back to table of contents](#toc-chapter-10) | [Next section](#toc-persistent-volumes-claims) ] .debug[(automatically generated title slide)] --- # Running a Consul cluster - Here is a good use-case for Stateful sets! - We are going to deploy a Consul cluster with 3 nodes - Consul is a highly-available key/value store (like etcd or Zookeeper) - One easy way to bootstrap a cluster is to tell each node: - the addresses of other nodes - how many nodes are expected (to know when quorum is reached) .debug[[k8s/statefulsets.md](https://github.com/BretFisher/kubernetes-mastery/tree/mastery/slides/k8s/statefulsets.md)] --- ## Bootstrapping a Consul cluster *After reading the Consul documentation carefully (and/or asking around), we figure out the minimal command-line to run our Consul cluster.* ``` consul agent -data-dir=/consul/data -client=0.0.0.0 -server -ui \ -bootstrap-expect=3 \ -retry-join=`X.X.X.X` \ -retry-join=`Y.Y.Y.Y` ``` - Replace X.X.X.X and Y.Y.Y.Y with the addresses of other nodes - The same command-line can be used on all nodes (convenient!) .debug[[k8s/statefulsets.md](https://github.com/BretFisher/kubernetes-mastery/tree/mastery/slides/k8s/statefulsets.md)] --- ## Cloud Auto-join - Since version 1.4.0, Consul can use the Kubernetes API to find its peers - This is called [Cloud Auto-join] - Instead of passing an IP address, we need to pass a parameter like this: ``` consul agent -retry-join "provider=k8s label_selector=\"app=consul\"" ``` - Consul needs to be able to talk to the Kubernetes API - We can provide a `kubeconfig` file - If Consul runs in a pod, it will use the *service account* of the pod [Cloud Auto-join]: https://www.consul.io/docs/agent/cloud-auto-join.html#kubernetes-k8s- .debug[[k8s/statefulsets.md](https://github.com/BretFisher/kubernetes-mastery/tree/mastery/slides/k8s/statefulsets.md)] --- ## Setting up Cloud auto-join - We need to create a service account for Consul - We need to create a role that can `list` and `get` pods - We need to bind that role to the service account - And of course, we need to make sure that Consul pods use that service account .debug[[k8s/statefulsets.md](https://github.com/BretFisher/kubernetes-mastery/tree/mastery/slides/k8s/statefulsets.md)] --- ## Putting it all together - The file `k8s/consul.yaml` defines the required resources (service account, cluster role, cluster role binding, service, stateful set) - It has a few extra touches: - a `podAntiAffinity` prevents two pods from running on the same node - a `preStop` hook makes the pod leave the cluster when shutdown gracefully This was inspired by this [excellent tutorial](https://github.com/kelseyhightower/consul-on-kubernetes) by Kelsey Hightower. Some features from the original tutorial (TLS authentication between nodes and encryption of gossip traffic) were removed for simplicity. .debug[[k8s/statefulsets.md](https://github.com/BretFisher/kubernetes-mastery/tree/mastery/slides/k8s/statefulsets.md)] --- ## Running our Consul cluster - We'll use the provided YAML file .exercise[ - Create the stateful set and associated service: ```bash kubectl apply -f ~/container.training/k8s/consul.yaml ``` - Check the logs as the pods come up one after another: ```bash stern consul ``` <!-- ```wait Synced node info``` ```key ^C``` --> - Check the health of the cluster: ```bash kubectl exec consul-0 consul members ``` ] .debug[[k8s/statefulsets.md](https://github.com/BretFisher/kubernetes-mastery/tree/mastery/slides/k8s/statefulsets.md)] --- ## Caveats - We aren't using actual persistence yet (no `volumeClaimTemplate`, Persistent Volume, etc.) - What happens if we lose a pod? - a new pod gets rescheduled (with an empty state) - the new pod tries to connect to the two others - it will be accepted (after 1-2 minutes of instability) - and it will retrieve the data from the other pods .debug[[k8s/statefulsets.md](https://github.com/BretFisher/kubernetes-mastery/tree/mastery/slides/k8s/statefulsets.md)] --- ## Failure modes - What happens if we lose two pods? - manual repair will be required - we will need to instruct the remaining one to act solo - then rejoin new pods - What happens if we lose three pods? (aka all of them) - we lose all the data (ouch) - If we run Consul without persistent storage, backups are a good idea! .debug[[k8s/statefulsets.md](https://github.com/BretFisher/kubernetes-mastery/tree/mastery/slides/k8s/statefulsets.md)] --- class: pic .interstitial[] --- name: toc-persistent-volumes-claims class: title Persistent Volumes Claims .nav[ [Previous section](#toc-running-a-consul-cluster) | [Back to table of contents](#toc-chapter-10) | [Next section](#toc-local-persistent-volumes) ] .debug[(automatically generated title slide)] --- # Persistent Volumes Claims - Our Pods can use a special volume type: a *Persistent Volume Claim* - A Persistent Volume Claim (PVC) is also a Kubernetes resource (visible with `kubectl get persistentvolumeclaims` or `kubectl get pvc`) - A PVC is not a volume; it is a *request for a volume* - It should indicate at least: - the size of the volume (e.g. "5 GiB") - the access mode (e.g. "read-write by a single pod") .debug[[k8s/statefulsets.md](https://github.com/BretFisher/kubernetes-mastery/tree/mastery/slides/k8s/statefulsets.md)] --- ## What's in a PVC? - A PVC contains at least: - a list of *access modes* (ReadWriteOnce, ReadOnlyMany, ReadWriteMany) - a size (interpreted as the minimal storage space needed) - It can also contain optional elements: - a selector (to restrict which actual volumes it can use) - a *storage class* (used by dynamic provisioning, more on that later) .debug[[k8s/statefulsets.md](https://github.com/BretFisher/kubernetes-mastery/tree/mastery/slides/k8s/statefulsets.md)] --- ## What does a PVC look like? Here is a manifest for a basic PVC: ```yaml kind: PersistentVolumeClaim apiVersion: v1 metadata: name: my-claim spec: accessModes: - ReadWriteOnce resources: requests: storage: 1Gi ``` .debug[[k8s/statefulsets.md](https://github.com/BretFisher/kubernetes-mastery/tree/mastery/slides/k8s/statefulsets.md)] --- ## Using a Persistent Volume Claim Here is a Pod definition like the ones shown earlier, but using a PVC: ```yaml apiVersion: v1 kind: Pod metadata: name: pod-using-a-claim spec: containers: - image: ... name: container-using-a-claim volumeMounts: - mountPath: /my-vol name: my-volume volumes: - name: my-volume persistentVolumeClaim: claimName: my-claim ``` .debug[[k8s/statefulsets.md](https://github.com/BretFisher/kubernetes-mastery/tree/mastery/slides/k8s/statefulsets.md)] --- ## Creating and using Persistent Volume Claims - PVCs can be created manually and used explicitly (as shown on the previous slides) - They can also be created and used through Stateful Sets (this will be shown later) .debug[[k8s/statefulsets.md](https://github.com/BretFisher/kubernetes-mastery/tree/mastery/slides/k8s/statefulsets.md)] --- ## Lifecycle of Persistent Volume Claims - When a PVC is created, it starts existing in "Unbound" state (without an associated volume) - A Pod referencing an unbound PVC will not start (the scheduler will wait until the PVC is bound to place it) - A special controller continuously monitors PVCs to associate them with PVs - If no PV is available, one must be created: - manually (by operator intervention) - using a *dynamic provisioner* (more on that later) .debug[[k8s/statefulsets.md](https://github.com/BretFisher/kubernetes-mastery/tree/mastery/slides/k8s/statefulsets.md)] --- class: extra-details ## Which PV gets associated to a PVC? - The PV must satisfy the PVC constraints (access mode, size, optional selector, optional storage class) - The PVs with the closest access mode are picked - Then the PVs with the closest size - It is possible to specify a `claimRef` when creating a PV (this will associate it to the specified PVC, but only if the PV satisfies all the requirements of the PVC; otherwise another PV might end up being picked) - For all the details about the PersistentVolumeClaimBinder, check [this doc](https://github.com/kubernetes/community/blob/master/contributors/design-proposals/storage/persistent-storage.md#matching-and-binding) .debug[[k8s/statefulsets.md](https://github.com/BretFisher/kubernetes-mastery/tree/mastery/slides/k8s/statefulsets.md)] --- ## Persistent Volume Claims and Stateful sets - A Stateful set can define one (or more) `volumeClaimTemplate` - Each `volumeClaimTemplate` will create one Persistent Volume Claim per pod - Each pod will therefore have its own individual volume - These volumes are numbered (like the pods) - Example: - a Stateful set is named `db` - it is scaled to replicas - it has a `volumeClaimTemplate` named `data` - then it will create pods `db-0`, `db-1`, `db-2` - these pods will have volumes named `data-db-0`, `data-db-1`, `data-db-2` .debug[[k8s/statefulsets.md](https://github.com/BretFisher/kubernetes-mastery/tree/mastery/slides/k8s/statefulsets.md)] --- ## Persistent Volume Claims are sticky - When updating the stateful set (e.g. image upgrade), each pod keeps its volume - When pods get rescheduled (e.g. node failure), they keep their volume (this requires a storage system that is not node-local) - These volumes are not automatically deleted (when the stateful set is scaled down or deleted) - If a stateful set is scaled back up later, the pods get their data back .debug[[k8s/statefulsets.md](https://github.com/BretFisher/kubernetes-mastery/tree/mastery/slides/k8s/statefulsets.md)] --- ## Dynamic provisioners - A *dynamic provisioner* monitors unbound PVCs - It can create volumes (and the corresponding PV) on the fly - This requires the PVCs to have a *storage class* (annotation `volume.beta.kubernetes.io/storage-provisioner`) - A dynamic provisioner only acts on PVCs with the right storage class (it ignores the other ones) - Just like `LoadBalancer` services, dynamic provisioners are optional (i.e. our cluster may or may not have one pre-installed) .debug[[k8s/statefulsets.md](https://github.com/BretFisher/kubernetes-mastery/tree/mastery/slides/k8s/statefulsets.md)] --- ## What's a Storage Class? - A Storage Class is yet another Kubernetes API resource (visible with e.g. `kubectl get storageclass` or `kubectl get sc`) - It indicates which *provisioner* to use (which controller will create the actual volume) - And arbitrary parameters for that provisioner (replication levels, type of disk ... anything relevant!) - Storage Classes are required if we want to use [dynamic provisioning](https://kubernetes.io/docs/concepts/storage/dynamic-provisioning/) (but we can also create volumes manually, and ignore Storage Classes) .debug[[k8s/statefulsets.md](https://github.com/BretFisher/kubernetes-mastery/tree/mastery/slides/k8s/statefulsets.md)] --- ## The default storage class - At most one storage class can be marked as the default class (by annotating it with `storageclass.kubernetes.io/is-default-class=true`) - When a PVC is created, it will be annotated with the default storage class (unless it specifies an explicit storage class) - This only happens at PVC creation (existing PVCs are not updated when we mark a class as the default one) .debug[[k8s/statefulsets.md](https://github.com/BretFisher/kubernetes-mastery/tree/mastery/slides/k8s/statefulsets.md)] --- ## Dynamic provisioning setup This is how we can achieve fully automated provisioning of persistent storage. 1. Configure a storage system. (It needs to have an API, or be capable of automated provisioning of volumes.) 2. Install a dynamic provisioner for this storage system. (This is some specific controller code.) 3. Create a Storage Class for this system. (It has to match what the dynamic provisioner is expecting.) 4. Annotate the Storage Class to be the default one. .debug[[k8s/statefulsets.md](https://github.com/BretFisher/kubernetes-mastery/tree/mastery/slides/k8s/statefulsets.md)] --- ## Dynamic provisioning usage After setting up the system (previous slide), all we need to do is: *Create a Stateful Set that makes use of a `volumeClaimTemplate`.* This will trigger the following actions. 1. The Stateful Set creates PVCs according to the `volumeClaimTemplate`. 2. The Stateful Set creates Pods using these PVCs. 3. The PVCs are automatically annotated with our Storage Class. 4. The dynamic provisioner provisions volumes and creates the corresponding PVs. 5. The PersistentVolumeClaimBinder associates the PVs and the PVCs together. 6. PVCs are now bound, the Pods can start. .debug[[k8s/statefulsets.md](https://github.com/BretFisher/kubernetes-mastery/tree/mastery/slides/k8s/statefulsets.md)] --- class: pic .interstitial[] --- name: toc-local-persistent-volumes class: title Local Persistent Volumes .nav[ [Previous section](#toc-persistent-volumes-claims) | [Back to table of contents](#toc-chapter-10) | [Next section](#toc-highly-available-persistent-volumes) ] .debug[(automatically generated title slide)] --- # Local Persistent Volumes - We want to run that Consul cluster *and* actually persist data - But we don't have a distributed storage system - We are going to use local volumes instead (similar conceptually to `hostPath` volumes) - We can use local volumes without installing extra plugins - However, they are tied to a node - If that node goes down, the volume becomes unavailable .debug[[k8s/local-persistent-volumes.md](https://github.com/BretFisher/kubernetes-mastery/tree/mastery/slides/k8s/local-persistent-volumes.md)] --- ## With or without dynamic provisioning - We will deploy a Consul cluster *with* persistence - That cluster's StatefulSet will create PVCs - These PVCs will remain unbound¹, until we will create local volumes manually (we will basically do the job of the dynamic provisioner) - Then, we will see how to automate that with a dynamic provisioner .footnote[¹Unbound = without an associated Persistent Volume.] .debug[[k8s/local-persistent-volumes.md](https://github.com/BretFisher/kubernetes-mastery/tree/mastery/slides/k8s/local-persistent-volumes.md)] --- ## If we have a dynamic provisioner ... - The labs in this section assume that we *do not* have a dynamic provisioner - If we do have one, we need to disable it .exercise[ - Check if we have a dynamic provisioner: ```bash kubectl get storageclass ``` - If the output contains a line with `(default)`, run this command: ```bash kubectl annotate sc storageclass.kubernetes.io/is-default-class- --all ``` - Check again that it is no longer marked as `(default)` ] .debug[[k8s/local-persistent-volumes.md](https://github.com/BretFisher/kubernetes-mastery/tree/mastery/slides/k8s/local-persistent-volumes.md)] --- ## Deploying Consul - We will use a slightly different YAML file - The only differences between that file and the previous one are: - `volumeClaimTemplate` defined in the Stateful Set spec - the corresponding `volumeMounts` in the Pod spec - the label `consul` has been changed to `persistentconsul` <br/> (to avoid conflicts with the other Stateful Set) .exercise[ - Apply the persistent Consul YAML file: ```bash kubectl apply -f ~/container.training/k8s/persistent-consul.yaml ``` ] .debug[[k8s/local-persistent-volumes.md](https://github.com/BretFisher/kubernetes-mastery/tree/mastery/slides/k8s/local-persistent-volumes.md)] --- ## Observing the situation - Let's look at Persistent Volume Claims and Pods .exercise[ - Check that we now have an unbound Persistent Volume Claim: ```bash kubectl get pvc ``` - We don't have any Persistent Volume: ```bash kubectl get pv ``` - The Pod `persistentconsul-0` is not scheduled yet: ```bash kubectl get pods -o wide ``` ] *Hint: leave these commands running with `-w` in different windows.* .debug[[k8s/local-persistent-volumes.md](https://github.com/BretFisher/kubernetes-mastery/tree/mastery/slides/k8s/local-persistent-volumes.md)] --- ## Explanations - In a Stateful Set, the Pods are started one by one - `persistentconsul-1` won't be created until `persistentconsul-0` is running - `persistentconsul-0` has a dependency on an unbound Persistent Volume Claim - The scheduler won't schedule the Pod until the PVC is bound (because the PVC might be bound to a volume that is only available on a subset of nodes; for instance EBS are tied to an availability zone) .debug[[k8s/local-persistent-volumes.md](https://github.com/BretFisher/kubernetes-mastery/tree/mastery/slides/k8s/local-persistent-volumes.md)] --- ## Creating Persistent Volumes - Let's create 3 local directories (`/mnt/consul`) on node2, node3, node4 - Then create 3 Persistent Volumes corresponding to these directories .exercise[ - Create the local directories: ```bash for NODE in node2 node3 node4; do ssh $NODE sudo mkdir -p /mnt/consul done ``` - Create the PV objects: ```bash kubectl apply -f ~/container.training/k8s/volumes-for-consul.yaml ``` ] .debug[[k8s/local-persistent-volumes.md](https://github.com/BretFisher/kubernetes-mastery/tree/mastery/slides/k8s/local-persistent-volumes.md)] --- ## Check our Consul cluster - The PVs that we created will be automatically matched with the PVCs - Once a PVC is bound, its pod can start normally - Once the pod `persistentconsul-0` has started, `persistentconsul-1` can be created, etc. - Eventually, our Consul cluster is up, and backend by "persistent" volumes .exercise[ - Check that our Consul clusters has 3 members indeed: ```bash kubectl exec persistentconsul-0 consul members ``` ] .debug[[k8s/local-persistent-volumes.md](https://github.com/BretFisher/kubernetes-mastery/tree/mastery/slides/k8s/local-persistent-volumes.md)] --- ## Devil is in the details (1/2) - The size of the Persistent Volumes is bogus (it is used when matching PVs and PVCs together, but there is no actual quota or limit) .debug[[k8s/local-persistent-volumes.md](https://github.com/BretFisher/kubernetes-mastery/tree/mastery/slides/k8s/local-persistent-volumes.md)] --- ## Devil is in the details (2/2) - This specific example worked because we had exactly 1 free PV per node: - if we had created multiple PVs per node ... - we could have ended with two PVCs bound to PVs on the same node ... - which would have required two pods to be on the same node ... - which is forbidden by the anti-affinity constraints in the StatefulSet - To avoid that, we need to associated the PVs with a Storage Class that has: ```yaml volumeBindingMode: WaitForFirstConsumer ``` (this means that a PVC will be bound to a PV only after being used by a Pod) - See [this blog post](https://kubernetes.io/blog/2018/04/13/local-persistent-volumes-beta/) for more details .debug[[k8s/local-persistent-volumes.md](https://github.com/BretFisher/kubernetes-mastery/tree/mastery/slides/k8s/local-persistent-volumes.md)] --- ## Bulk provisioning - It's not practical to manually create directories and PVs for each app - We *could* pre-provision a number of PVs across our fleet - We could even automate that with a Daemon Set: - creating a number of directories on each node - creating the corresponding PV objects - We also need to recycle volumes - ... This can quickly get out of hand .debug[[k8s/local-persistent-volumes.md](https://github.com/BretFisher/kubernetes-mastery/tree/mastery/slides/k8s/local-persistent-volumes.md)] --- ## Dynamic provisioning - We could also write our own provisioner, which would: - watch the PVCs across all namespaces - when a PVC is created, create a corresponding PV on a node - Or we could use one of the dynamic provisioners for local persistent volumes (for instance the [Rancher local path provisioner](https://github.com/rancher/local-path-provisioner)) .debug[[k8s/local-persistent-volumes.md](https://github.com/BretFisher/kubernetes-mastery/tree/mastery/slides/k8s/local-persistent-volumes.md)] --- ## Strategies for local persistent volumes - Remember, when a node goes down, the volumes on that node become unavailable - High availability will require another layer of replication (like what we've just seen with Consul; or primary/secondary; etc) - Pre-provisioning PVs makes sense for machines with local storage (e.g. cloud instance storage; or storage directly attached to a physical machine) - Dynamic provisioning makes sense for large number of applications (when we can't or won't dedicate a whole disk to a volume) - It's possible to mix both (using distinct Storage Classes) .debug[[k8s/local-persistent-volumes.md](https://github.com/BretFisher/kubernetes-mastery/tree/mastery/slides/k8s/local-persistent-volumes.md)] --- class: pic .interstitial[] --- name: toc-highly-available-persistent-volumes class: title Highly available Persistent Volumes .nav[ [Previous section](#toc-local-persistent-volumes) | [Back to table of contents](#toc-chapter-10) | [Next section](#toc-centralized-logging) ] .debug[(automatically generated title slide)] --- # Highly available Persistent Volumes - How can we achieve true durability? - How can we store data that would survive the loss of a node? -- - We need to use Persistent Volumes backed by highly available storage systems - There are many ways to achieve that: - leveraging our cloud's storage APIs - using NAS/SAN systems or file servers - distributed storage systems -- - We are going to see one distributed storage system in action .debug[[k8s/portworx.md](https://github.com/BretFisher/kubernetes-mastery/tree/mastery/slides/k8s/portworx.md)] --- ## Our test scenario - We will set up a distributed storage system on our cluster - We will use it to deploy a SQL database (PostgreSQL) - We will insert some test data in the database - We will disrupt the node running the database - We will see how it recovers .debug[[k8s/portworx.md](https://github.com/BretFisher/kubernetes-mastery/tree/mastery/slides/k8s/portworx.md)] --- ## Portworx - Portworx is a *commercial* persistent storage solution for containers - It works with Kubernetes, but also Mesos, Swarm ... - It provides [hyper-converged](https://en.wikipedia.org/wiki/Hyper-converged_infrastructure) storage (=storage is provided by regular compute nodes) - We're going to use it here because it can be deployed on any Kubernetes cluster (it doesn't require any particular infrastructure) - We don't endorse or support Portworx in any particular way (but we appreciate that it's super easy to install!) .debug[[k8s/portworx.md](https://github.com/BretFisher/kubernetes-mastery/tree/mastery/slides/k8s/portworx.md)] --- ## A useful reminder - We're installing Portworx because we need a storage system - If you are using AKS, EKS, GKE ... you already have a storage system (but you might want another one, e.g. to leverage local storage) - If you have setup Kubernetes yourself, there are other solutions available too - on premises, you can use a good old SAN/NAS - on a private cloud like OpenStack, you can use e.g. Cinder - everywhere, you can use other systems, e.g. Gluster, StorageOS .debug[[k8s/portworx.md](https://github.com/BretFisher/kubernetes-mastery/tree/mastery/slides/k8s/portworx.md)] --- ## Portworx requirements - Kubernetes cluster ✔️ - Optional key/value store (etcd or Consul) ❌ - At least one available block device ❌ .debug[[k8s/portworx.md](https://github.com/BretFisher/kubernetes-mastery/tree/mastery/slides/k8s/portworx.md)] --- ## The key-value store - In the current version of Portworx (1.4) it is recommended to use etcd or Consul - But Portworx also has beta support for an embedded key/value store - For simplicity, we are going to use the latter option (but if we have deployed Consul or etcd, we can use that, too) .debug[[k8s/portworx.md](https://github.com/BretFisher/kubernetes-mastery/tree/mastery/slides/k8s/portworx.md)] --- ## One available block device - Block device = disk or partition on a disk - We can see block devices with `lsblk` (or `cat /proc/partitions` if we're old school like that!) - If we don't have a spare disk or partition, we can use a *loop device* - A loop device is a block device actually backed by a file - These are frequently used to mount ISO (CD/DVD) images or VM disk images .debug[[k8s/portworx.md](https://github.com/BretFisher/kubernetes-mastery/tree/mastery/slides/k8s/portworx.md)] --- ## Setting up a loop device - We are going to create a 10 GB (empty) file on each node - Then make a loop device from it, to be used by Portworx .exercise[ - Create a 10 GB file on each node: ```bash for N in $(seq 1 4); do ssh node$N sudo truncate --size 10G /portworx.blk; done ``` (If SSH asks to confirm host keys, enter `yes` each time.) - Associate the file to a loop device on each node: ```bash for N in $(seq 1 4); do ssh node$N sudo losetup /dev/loop4 /portworx.blk; done ``` ] .debug[[k8s/portworx.md](https://github.com/BretFisher/kubernetes-mastery/tree/mastery/slides/k8s/portworx.md)] --- ## Installing Portworx - To install Portworx, we need to go to https://install.portworx.com/ - This website will ask us a bunch of questions about our cluster - Then, it will generate a YAML file that we should apply to our cluster -- - Or, we can just apply that YAML file directly (it's in `k8s/portworx.yaml`) .exercise[ - Install Portworx: ```bash kubectl apply -f ~/container.training/k8s/portworx.yaml ``` ] .debug[[k8s/portworx.md](https://github.com/BretFisher/kubernetes-mastery/tree/mastery/slides/k8s/portworx.md)] --- class: extra-details ## Generating a custom YAML file If you want to generate a YAML file tailored to your own needs, the easiest way is to use https://install.portworx.com/. FYI, this is how we obtained the YAML file used earlier: ``` KBVER=$(kubectl version -o json | jq -r .serverVersion.gitVersion) BLKDEV=/dev/loop4 curl https://install.portworx.com/1.4/?kbver=$KBVER&b=true&s=$BLKDEV&c=px-workshop&stork=true&lh=true ``` If you want to use an external key/value store, add one of the following: ``` &k=etcd://`XXX`:2379 &k=consul://`XXX`:8500 ``` ... where `XXX` is the name or address of your etcd or Consul server. .debug[[k8s/portworx.md](https://github.com/BretFisher/kubernetes-mastery/tree/mastery/slides/k8s/portworx.md)] --- ## Waiting for Portworx to be ready - The installation process will take a few minutes .exercise[ - Check out the logs: ```bash stern -n kube-system portworx ``` - Wait until it gets quiet (you should see `portworx service is healthy`, too) <!-- ```longwait PX node status reports portworx service is healthy``` ```key ^C``` --> ] .debug[[k8s/portworx.md](https://github.com/BretFisher/kubernetes-mastery/tree/mastery/slides/k8s/portworx.md)] --- ## Dynamic provisioning of persistent volumes - We are going to run PostgreSQL in a Stateful set - The Stateful set will specify a `volumeClaimTemplate` - That `volumeClaimTemplate` will create Persistent Volume Claims - Kubernetes' [dynamic provisioning](https://kubernetes.io/docs/concepts/storage/dynamic-provisioning/) will satisfy these Persistent Volume Claims (by creating Persistent Volumes and binding them to the claims) - The Persistent Volumes are then available for the PostgreSQL pods .debug[[k8s/portworx.md](https://github.com/BretFisher/kubernetes-mastery/tree/mastery/slides/k8s/portworx.md)] --- ## Storage Classes - It's possible that multiple storage systems are available - Or, that a storage system offers multiple tiers of storage (SSD vs. magnetic; mirrored or not; etc.) - We need to tell Kubernetes *which* system and tier to use - This is achieved by creating a Storage Class - A `volumeClaimTemplate` can indicate which Storage Class to use - It is also possible to mark a Storage Class as "default" (it will be used if a `volumeClaimTemplate` doesn't specify one) .debug[[k8s/portworx.md](https://github.com/BretFisher/kubernetes-mastery/tree/mastery/slides/k8s/portworx.md)] --- ## Check our default Storage Class - The YAML manifest applied earlier should define a default storage class .exercise[ - Check that we have a default storage class: ```bash kubectl get storageclass ``` ] There should be a storage class showing as `portworx-replicated (default)`. .debug[[k8s/portworx.md](https://github.com/BretFisher/kubernetes-mastery/tree/mastery/slides/k8s/portworx.md)] --- class: extra-details ## Our default Storage Class This is our Storage Class (in `k8s/storage-class.yaml`): ```yaml kind: StorageClass apiVersion: storage.k8s.io/v1beta1 metadata: name: portworx-replicated annotations: storageclass.kubernetes.io/is-default-class: "true" provisioner: kubernetes.io/portworx-volume parameters: repl: "2" priority_io: "high" ``` - It says "use Portworx to create volumes" - It tells Portworx to "keep 2 replicas of these volumes" - It marks the Storage Class as being the default one .debug[[k8s/portworx.md](https://github.com/BretFisher/kubernetes-mastery/tree/mastery/slides/k8s/portworx.md)] --- ## Our Postgres Stateful set - The next slide shows `k8s/postgres.yaml` - It defines a Stateful set - With a `volumeClaimTemplate` requesting a 1 GB volume - That volume will be mounted to `/var/lib/postgresql/data` - There is another little detail: we enable the `stork` scheduler - The `stork` scheduler is optional (it's specific to Portworx) - It helps the Kubernetes scheduler to colocate the pod with its volume (see [this blog post](https://portworx.com/stork-storage-orchestration-kubernetes/) for more details about that) .debug[[k8s/portworx.md](https://github.com/BretFisher/kubernetes-mastery/tree/mastery/slides/k8s/portworx.md)] --- .small[ ```yaml apiVersion: apps/v1 kind: StatefulSet metadata: name: postgres spec: selector: matchLabels: app: postgres serviceName: postgres template: metadata: labels: app: postgres spec: schedulerName: stork containers: - name: postgres image: postgres:11 volumeMounts: - mountPath: /var/lib/postgresql/data name: postgres volumeClaimTemplates: - metadata: name: postgres spec: accessModes: ["ReadWriteOnce"] resources: requests: storage: 1Gi ``` ] .debug[[k8s/portworx.md](https://github.com/BretFisher/kubernetes-mastery/tree/mastery/slides/k8s/portworx.md)] --- ## Creating the Stateful set - Before applying the YAML, watch what's going on with `kubectl get events -w` .exercise[ - Apply that YAML: ```bash kubectl apply -f ~/container.training/k8s/postgres.yaml ``` <!-- ```hide kubectl wait pod postgres-0 --for condition=ready``` --> ] .debug[[k8s/portworx.md](https://github.com/BretFisher/kubernetes-mastery/tree/mastery/slides/k8s/portworx.md)] --- ## Testing our PostgreSQL pod - We will use `kubectl exec` to get a shell in the pod - Good to know: we need to use the `postgres` user in the pod .exercise[ - Get a shell in the pod, as the `postgres` user: ```bash kubectl exec -ti postgres-0 su postgres ``` <!-- autopilot prompt detection expects $ or # at the beginning of the line. ```wait postgres@postgres``` ```keys PS1="\u@\h:\w\n\$ "``` ```key ^J``` --> - Check that default databases have been created correctly: ```bash psql -l ``` ] (This should show us 3 lines: postgres, template0, and template1.) .debug[[k8s/portworx.md](https://github.com/BretFisher/kubernetes-mastery/tree/mastery/slides/k8s/portworx.md)] --- ## Inserting data in PostgreSQL - We will create a database and populate it with `pgbench` .exercise[ - Create a database named `demo`: ```bash createdb demo ``` - Populate it with `pgbench`: ```bash pgbench -i -s 10 demo ``` ] - The `-i` flag means "create tables" - The `-s 10` flag means "create 10 x 100,000 rows" .debug[[k8s/portworx.md](https://github.com/BretFisher/kubernetes-mastery/tree/mastery/slides/k8s/portworx.md)] --- ## Checking how much data we have now - The `pgbench` tool inserts rows in table `pgbench_accounts` .exercise[ - Check that the `demo` base exists: ```bash psql -l ``` - Check how many rows we have in `pgbench_accounts`: ```bash psql demo -c "select count(*) from pgbench_accounts" ``` <!-- ```key ^D``` --> ] (We should see a count of 1,000,000 rows.) .debug[[k8s/portworx.md](https://github.com/BretFisher/kubernetes-mastery/tree/mastery/slides/k8s/portworx.md)] --- ## Find out which node is hosting the database - We can find that information with `kubectl get pods -o wide` .exercise[ - Check the node running the database: ```bash kubectl get pod postgres-0 -o wide ``` ] We are going to disrupt that node. -- By "disrupt" we mean: "disconnect it from the network". .debug[[k8s/portworx.md](https://github.com/BretFisher/kubernetes-mastery/tree/mastery/slides/k8s/portworx.md)] --- ## Disconnect the node - We will use `iptables` to block all traffic exiting the node (except SSH traffic, so we can repair the node later if needed) .exercise[ - SSH to the node to disrupt: ```bash ssh `nodeX` ``` - Allow SSH traffic leaving the node, but block all other traffic: ```bash sudo iptables -I OUTPUT -p tcp --sport 22 -j ACCEPT sudo iptables -I OUTPUT 2 -j DROP ``` ] .debug[[k8s/portworx.md](https://github.com/BretFisher/kubernetes-mastery/tree/mastery/slides/k8s/portworx.md)] --- ## Check that the node is disconnected .exercise[ - Check that the node can't communicate with other nodes: ``` ping node1 ``` - Logout to go back on `node1` <!-- ```key ^D``` --> - Watch the events unfolding with `kubectl get events -w` and `kubectl get pods -w` ] - It will take some time for Kubernetes to mark the node as unhealthy - Then it will attempt to reschedule the pod to another node - In about a minute, our pod should be up and running again .debug[[k8s/portworx.md](https://github.com/BretFisher/kubernetes-mastery/tree/mastery/slides/k8s/portworx.md)] --- ## Check that our data is still available - We are going to reconnect to the (new) pod and check .exercise[ - Get a shell on the pod: ```bash kubectl exec -ti postgres-0 su postgres ``` <!-- ```wait postgres@postgres``` ```keys PS1="\u@\h:\w\n\$ "``` ```key ^J``` --> - Check the number of rows in the `pgbench_accounts` table: ```bash psql demo -c "select count(*) from pgbench_accounts" ``` <!-- ```key ^D``` --> ] .debug[[k8s/portworx.md](https://github.com/BretFisher/kubernetes-mastery/tree/mastery/slides/k8s/portworx.md)] --- ## Double-check that the pod has really moved - Just to make sure the system is not bluffing! .exercise[ - Look at which node the pod is now running on ```bash kubectl get pod postgres-0 -o wide ``` ] .debug[[k8s/portworx.md](https://github.com/BretFisher/kubernetes-mastery/tree/mastery/slides/k8s/portworx.md)] --- ## Re-enable the node - Let's fix the node that we disconnected from the network .exercise[ - SSH to the node: ```bash ssh `nodeX` ``` - Remove the iptables rule blocking traffic: ```bash sudo iptables -D OUTPUT 2 ``` ] .debug[[k8s/portworx.md](https://github.com/BretFisher/kubernetes-mastery/tree/mastery/slides/k8s/portworx.md)] --- class: extra-details ## A few words about this PostgreSQL setup - In a real deployment, you would want to set a password - This can be done by creating a `secret`: ``` kubectl create secret generic postgres \ --from-literal=password=$(base64 /dev/urandom | head -c16) ``` - And then passing that secret to the container: ```yaml env: - name: POSTGRES_PASSWORD valueFrom: secretKeyRef: name: postgres key: password ``` .debug[[k8s/portworx.md](https://github.com/BretFisher/kubernetes-mastery/tree/mastery/slides/k8s/portworx.md)] --- class: extra-details ## Troubleshooting Portworx - If we need to see what's going on with Portworx: ``` PXPOD=$(kubectl -n kube-system get pod -l name=portworx -o json | jq -r .items[0].metadata.name) kubectl -n kube-system exec $PXPOD -- /opt/pwx/bin/pxctl status ``` - We can also connect to Lighthouse (a web UI) - check the port with `kubectl -n kube-system get svc px-lighthouse` - connect to that port - the default login/password is `admin/Password1` - then specify `portworx-service` as the endpoint .debug[[k8s/portworx.md](https://github.com/BretFisher/kubernetes-mastery/tree/mastery/slides/k8s/portworx.md)] --- class: extra-details ## Removing Portworx - Portworx provides a storage driver - It needs to place itself "above" the Kubelet (it installs itself straight on the nodes) - To remove it, we need to do more than just deleting its Kubernetes resources - It is done by applying a special label: ``` kubectl label nodes --all px/enabled=remove --overwrite ``` - Then removing a bunch of local files: ``` sudo chattr -i /etc/pwx/.private.json sudo rm -rf /etc/pwx /opt/pwx ``` (on each node where Portworx was running) .debug[[k8s/portworx.md](https://github.com/BretFisher/kubernetes-mastery/tree/mastery/slides/k8s/portworx.md)] --- class: extra-details ## Dynamic provisioning without a provider - What if we want to use Stateful sets without a storage provider? - We will have to create volumes manually (by creating Persistent Volume objects) - These volumes will be automatically bound with matching Persistent Volume Claims - We can use local volumes (essentially bind mounts of host directories) - Of course, these volumes won't be available in case of node failure - Check [this blog post](https://kubernetes.io/blog/2018/04/13/local-persistent-volumes-beta/) for more information and gotchas .debug[[k8s/portworx.md](https://github.com/BretFisher/kubernetes-mastery/tree/mastery/slides/k8s/portworx.md)] --- ## Acknowledgements The Portworx installation tutorial, and the PostgreSQL example, were inspired by [Portworx examples on Katacoda](https://katacoda.com/portworx/scenarios/), in particular: - [installing Portworx on Kubernetes](https://www.katacoda.com/portworx/scenarios/deploy-px-k8s) (with adapatations to use a loop device and an embedded key/value store) - [persistent volumes on Kubernetes using Portworx](https://www.katacoda.com/portworx/scenarios/px-k8s-vol-basic) (with adapatations to specify a default Storage Class) - [HA PostgreSQL on Kubernetes with Portworx](https://www.katacoda.com/portworx/scenarios/px-k8s-postgres-all-in-one) (with adaptations to use a Stateful Set and simplify PostgreSQL's setup) .debug[[k8s/portworx.md](https://github.com/BretFisher/kubernetes-mastery/tree/mastery/slides/k8s/portworx.md)] --- class: pic .interstitial[] --- name: toc-centralized-logging class: title Centralized logging .nav[ [Previous section](#toc-highly-available-persistent-volumes) | [Back to table of contents](#toc-chapter-11) | [Next section](#toc-collecting-metrics-with-prometheus) ] .debug[(automatically generated title slide)] --- # Centralized logging - Using `kubectl` or `stern` is simple; but it has drawbacks: - when a node goes down, its logs are not available anymore - we can only dump or stream logs; we want to search/index/count... - We want to send all our logs to a single place - We want to parse them (e.g. for HTTP logs) and index them - We want a nice web dashboard -- - We are going to deploy an EFK stack .debug[[k8s/logs-centralized.md](https://github.com/BretFisher/kubernetes-mastery/tree/mastery/slides/k8s/logs-centralized.md)] --- ## What is EFK? - EFK is three components: - ElasticSearch (to store and index log entries) - Fluentd (to get container logs, process them, and put them in ElasticSearch) - Kibana (to view/search log entries with a nice UI) - The only component that we need to access from outside the cluster will be Kibana .debug[[k8s/logs-centralized.md](https://github.com/BretFisher/kubernetes-mastery/tree/mastery/slides/k8s/logs-centralized.md)] --- ## Deploying EFK on our cluster - We are going to use a YAML file describing all the required resources .exercise[ - Load the YAML file into our cluster: ```bash kubectl apply -f ~/container.training/k8s/efk.yaml ``` ] If we [look at the YAML file](https://github.com/jpetazzo/container.training/blob/master/k8s/efk.yaml), we see that it creates a daemon set, two deployments, two services, and a few roles and role bindings (to give fluentd the required permissions). .debug[[k8s/logs-centralized.md](https://github.com/BretFisher/kubernetes-mastery/tree/mastery/slides/k8s/logs-centralized.md)] --- ## The itinerary of a log line (before Fluentd) - A container writes a line on stdout or stderr - Both are typically piped to the container engine (Docker or otherwise) - The container engine reads the line, and sends it to a logging driver - The timestamp and stream (stdout or stderr) is added to the log line - With the default configuration for Kubernetes, the line is written to a JSON file (`/var/log/containers/pod-name_namespace_container-id.log`) - That file is read when we invoke `kubectl logs`; we can access it directly too .debug[[k8s/logs-centralized.md](https://github.com/BretFisher/kubernetes-mastery/tree/mastery/slides/k8s/logs-centralized.md)] --- ## The itinerary of a log line (with Fluentd) - Fluentd runs on each node (thanks to a daemon set) - It bind-mounts `/var/log/containers` from the host (to access these files) - It continuously scans this directory for new files; reads them; parses them - Each log line becomes a JSON object, fully annotated with extra information: <br/>container id, pod name, Kubernetes labels... - These JSON objects are stored in ElasticSearch - ElasticSearch indexes the JSON objects - We can access the logs through Kibana (and perform searches, counts, etc.) .debug[[k8s/logs-centralized.md](https://github.com/BretFisher/kubernetes-mastery/tree/mastery/slides/k8s/logs-centralized.md)] --- ## Accessing Kibana - Kibana offers a web interface that is relatively straightforward - Let's check it out! .exercise[ - Check which `NodePort` was allocated to Kibana: ```bash kubectl get svc kibana ``` - With our web browser, connect to Kibana ] .debug[[k8s/logs-centralized.md](https://github.com/BretFisher/kubernetes-mastery/tree/mastery/slides/k8s/logs-centralized.md)] --- ## Using Kibana *Note: this is not a Kibana workshop! So this section is deliberately very terse.* - The first time you connect to Kibana, you must "configure an index pattern" - Just use the one that is suggested, `@timestamp`.red[*] - Then click "Discover" (in the top-left corner) - You should see container logs - Advice: in the left column, select a few fields to display, e.g.: `kubernetes.host`, `kubernetes.pod_name`, `stream`, `log` .red[*]If you don't see `@timestamp`, it's probably because no logs exist yet. <br/>Wait a bit, and double-check the logging pipeline! .debug[[k8s/logs-centralized.md](https://github.com/BretFisher/kubernetes-mastery/tree/mastery/slides/k8s/logs-centralized.md)] --- ## Caveat emptor We are using EFK because it is relatively straightforward to deploy on Kubernetes, without having to redeploy or reconfigure our cluster. But it doesn't mean that it will always be the best option for your use-case. If you are running Kubernetes in the cloud, you might consider using the cloud provider's logging infrastructure (if it can be integrated with Kubernetes). The deployment method that we will use here has been simplified: there is only one ElasticSearch node. In a real deployment, you might use a cluster, both for performance and reliability reasons. But this is outside of the scope of this chapter. The YAML file that we used creates all the resources in the `default` namespace, for simplicity. In a real scenario, you will create the resources in the `kube-system` namespace or in a dedicated namespace. .debug[[k8s/logs-centralized.md](https://github.com/BretFisher/kubernetes-mastery/tree/mastery/slides/k8s/logs-centralized.md)] --- class: pic .interstitial[] --- name: toc-collecting-metrics-with-prometheus class: title Collecting metrics with Prometheus .nav[ [Previous section](#toc-centralized-logging) | [Back to table of contents](#toc-chapter-11) | [Next section](#toc-resource-limits) ] .debug[(automatically generated title slide)] --- # Collecting metrics with Prometheus - Prometheus is an open-source monitoring system including: - multiple *service discovery* backends to figure out which metrics to collect - a *scraper* to collect these metrics - an efficient *time series database* to store these metrics - a specific query language (PromQL) to query these time series - an *alert manager* to notify us according to metrics values or trends - We are going to use it to collect and query some metrics on our Kubernetes cluster .debug[[k8s/prometheus.md](https://github.com/BretFisher/kubernetes-mastery/tree/mastery/slides/k8s/prometheus.md)] --- ## Why Prometheus? - We don't endorse Prometheus more or less than any other system - It's relatively well integrated within the cloud-native ecosystem - It can be self-hosted (this is useful for tutorials like this) - It can be used for deployments of varying complexity: - one binary and 10 lines of configuration to get started - all the way to thousands of nodes and millions of metrics .debug[[k8s/prometheus.md](https://github.com/BretFisher/kubernetes-mastery/tree/mastery/slides/k8s/prometheus.md)] --- ## Exposing metrics to Prometheus - Prometheus obtains metrics and their values by querying *exporters* - An exporter serves metrics over HTTP, in plain text - This is what the *node exporter* looks like: http://demo.robustperception.io:9100/metrics - Prometheus itself exposes its own internal metrics, too: http://demo.robustperception.io:9090/metrics - If you want to expose custom metrics to Prometheus: - serve a text page like these, and you're good to go - libraries are available in various languages to help with quantiles etc. .debug[[k8s/prometheus.md](https://github.com/BretFisher/kubernetes-mastery/tree/mastery/slides/k8s/prometheus.md)] --- ## How Prometheus gets these metrics - The *Prometheus server* will *scrape* URLs like these at regular intervals (by default: every minute; can be more/less frequent) - The list of URLs to scrape (the *scrape targets*) is defined in configuration .footnote[Worried about the overhead of parsing a text format? <br/> Check this [comparison](https://github.com/RichiH/OpenMetrics/blob/master/markdown/protobuf_vs_text.md) of the text format with the (now deprecated) protobuf format!] .debug[[k8s/prometheus.md](https://github.com/BretFisher/kubernetes-mastery/tree/mastery/slides/k8s/prometheus.md)] --- ## Defining scrape targets This is maybe the simplest configuration file for Prometheus: ```yaml scrape_configs: - job_name: 'prometheus' static_configs: - targets: ['localhost:9090'] ``` - In this configuration, Prometheus collects its own internal metrics - A typical configuration file will have multiple `scrape_configs` - In this configuration, the list of targets is fixed - A typical configuration file will use dynamic service discovery .debug[[k8s/prometheus.md](https://github.com/BretFisher/kubernetes-mastery/tree/mastery/slides/k8s/prometheus.md)] --- ## Service discovery This configuration file will leverage existing DNS `A` records: ```yaml scrape_configs: - ... - job_name: 'node' dns_sd_configs: - names: ['api-backends.dc-paris-2.enix.io'] type: 'A' port: 9100 ``` - In this configuration, Prometheus resolves the provided name(s) (here, `api-backends.dc-paris-2.enix.io`) - Each resulting IP address is added as a target on port 9100 .debug[[k8s/prometheus.md](https://github.com/BretFisher/kubernetes-mastery/tree/mastery/slides/k8s/prometheus.md)] --- ## Dynamic service discovery - In the DNS example, the names are re-resolved at regular intervals - As DNS records are created/updated/removed, scrape targets change as well - Existing data (previously collected metrics) is not deleted - Other service discovery backends work in a similar fashion .debug[[k8s/prometheus.md](https://github.com/BretFisher/kubernetes-mastery/tree/mastery/slides/k8s/prometheus.md)] --- ## Other service discovery mechanisms - Prometheus can connect to e.g. a cloud API to list instances - Or to the Kubernetes API to list nodes, pods, services ... - Or a service like Consul, Zookeeper, etcd, to list applications - The resulting configurations files are *way more complex* (but don't worry, we won't need to write them ourselves) .debug[[k8s/prometheus.md](https://github.com/BretFisher/kubernetes-mastery/tree/mastery/slides/k8s/prometheus.md)] --- ## Time series database - We could wonder, "why do we need a specialized database?" - One metrics data point = metrics ID + timestamp + value - With a classic SQL or noSQL data store, that's at least 160 bits of data + indexes - Prometheus is way more efficient, without sacrificing performance (it will even be gentler on the I/O subsystem since it needs to write less) - Would you like to know more? Check this video: [Storage in Prometheus 2.0](https://www.youtube.com/watch?v=C4YV-9CrawA) by [Goutham V](https://twitter.com/putadent) at DC17EU .debug[[k8s/prometheus.md](https://github.com/BretFisher/kubernetes-mastery/tree/mastery/slides/k8s/prometheus.md)] --- ## Checking if Prometheus is installed - Before trying to install Prometheus, let's check if it's already there .exercise[ - Look for services with a label `app=prometheus` across all namespaces: ```bash kubectl get services --selector=app=prometheus --all-namespaces ``` ] If we see a `NodePort` service called `prometheus-server`, we're good! (We can then skip to "Connecting to the Prometheus web UI".) .debug[[k8s/prometheus.md](https://github.com/BretFisher/kubernetes-mastery/tree/mastery/slides/k8s/prometheus.md)] --- ## Running Prometheus on our cluster We need to: - Run the Prometheus server in a pod (using e.g. a Deployment to ensure that it keeps running) - Expose the Prometheus server web UI (e.g. with a NodePort) - Run the *node exporter* on each node (with a Daemon Set) - Set up a Service Account so that Prometheus can query the Kubernetes API - Configure the Prometheus server (storing the configuration in a Config Map for easy updates) .debug[[k8s/prometheus.md](https://github.com/BretFisher/kubernetes-mastery/tree/mastery/slides/k8s/prometheus.md)] --- ## Helm charts to the rescue - To make our lives easier, we are going to use a Helm chart - The Helm chart will take care of all the steps explained above (including some extra features that we don't need, but won't hurt) .debug[[k8s/prometheus.md](https://github.com/BretFisher/kubernetes-mastery/tree/mastery/slides/k8s/prometheus.md)] --- ## Step 1: install Helm - If we already installed Helm earlier, this command won't break anything .exercise[ - Install the Helm CLI: ```bash curl https://raw.githubusercontent.com/kubernetes/helm/master/scripts/get-helm-3 \ | bash ``` ] .debug[[k8s/prometheus.md](https://github.com/BretFisher/kubernetes-mastery/tree/mastery/slides/k8s/prometheus.md)] --- ## Step 2: add the `stable` repo - This will add the repository containing the chart for Prometheus - This command is idempotent (it won't break anything if the repository was already added) .exercise[ - Add the repository: ```bash helm repo add stable https://kubernetes-charts.storage.googleapis.com/ ``` ] .debug[[k8s/prometheus.md](https://github.com/BretFisher/kubernetes-mastery/tree/mastery/slides/k8s/prometheus.md)] --- ## Step 3: install Prometheus - The following command, just like the previous ones, is idempotent (it won't error out if Prometheus is already installed) .exercise[ - Install Prometheus on our cluster: ```bash helm upgrade prometheus stable/prometheus \ --install \ --namespace kube-system \ --set server.service.type=NodePort \ --set server.service.nodePort=30090 \ --set server.persistentVolume.enabled=false \ --set alertmanager.enabled=false ``` ] Curious about all these flags? They're explained in the next slide. .debug[[k8s/prometheus.md](https://github.com/BretFisher/kubernetes-mastery/tree/mastery/slides/k8s/prometheus.md)] --- class: extra-details ## Explaining all the Helm flags - `helm upgrade prometheus` → upgrade release "prometheus" to the latest version... (a "release" is a unique name given to an app deployed with Helm) - `stable/prometheus` → ... of the chart `prometheus` in repo `stable` - `--install` → if the app doesn't exist, create it - `--namespace kube-system` → put it in that specific namespace - And set the following *values* when rendering the chart's templates: - `server.service.type=NodePort` → expose the Prometheus server with a NodePort - `server.service.nodePort=30090` → set the specific NodePort number to use - `server.persistentVolume.enabled=false` → do not use a PersistentVolumeClaim - `alertmanager.enabled=false` → disable the alert manager entirely .debug[[k8s/prometheus.md](https://github.com/BretFisher/kubernetes-mastery/tree/mastery/slides/k8s/prometheus.md)] --- ## Connecting to the Prometheus web UI - Let's connect to the web UI and see what we can do .exercise[ - Figure out the NodePort that was allocated to the Prometheus server: ```bash kubectl get svc --all-namespaces | grep prometheus-server ``` - With your browser, connect to that port ] .debug[[k8s/prometheus.md](https://github.com/BretFisher/kubernetes-mastery/tree/mastery/slides/k8s/prometheus.md)] --- ## Querying some metrics - This is easy... if you are familiar with PromQL .exercise[ - Click on "Graph", and in "expression", paste the following: ``` sum by (instance) ( irate( container_cpu_usage_seconds_total{ pod_name=~"worker.*" }[5m] ) ) ``` ] - Click on the blue "Execute" button and on the "Graph" tab just below - We see the cumulated CPU usage of worker pods for each node <br/> (if we just deployed Prometheus, there won't be much data to see, though) .debug[[k8s/prometheus.md](https://github.com/BretFisher/kubernetes-mastery/tree/mastery/slides/k8s/prometheus.md)] --- ## Getting started with PromQL - We can't learn PromQL in just 5 minutes - But we can cover the basics to get an idea of what is possible (and have some keywords and pointers) - We are going to break down the query above (building it one step at a time) .debug[[k8s/prometheus.md](https://github.com/BretFisher/kubernetes-mastery/tree/mastery/slides/k8s/prometheus.md)] --- ## Graphing one metric across all tags This query will show us CPU usage across all containers: ``` container_cpu_usage_seconds_total ``` - The suffix of the metrics name tells us: - the unit (seconds of CPU) - that it's the total used since the container creation - Since it's a "total," it is an increasing quantity (we need to compute the derivative if we want e.g. CPU % over time) - We see that the metrics retrieved have *tags* attached to them .debug[[k8s/prometheus.md](https://github.com/BretFisher/kubernetes-mastery/tree/mastery/slides/k8s/prometheus.md)] --- ## Selecting metrics with tags This query will show us only metrics for worker containers: ``` container_cpu_usage_seconds_total{pod_name=~"worker.*"} ``` - The `=~` operator allows regex matching - We select all the pods with a name starting with `worker` (it would be better to use labels to select pods; more on that later) - The result is a smaller set of containers .debug[[k8s/prometheus.md](https://github.com/BretFisher/kubernetes-mastery/tree/mastery/slides/k8s/prometheus.md)] --- ## Transforming counters in rates This query will show us CPU usage % instead of total seconds used: ``` 100*irate(container_cpu_usage_seconds_total{pod_name=~"worker.*"}[5m]) ``` - The [`irate`](https://prometheus.io/docs/prometheus/latest/querying/functions/#irate) operator computes the "per-second instant rate of increase" - `rate` is similar but allows decreasing counters and negative values - with `irate`, if a counter goes back to zero, we don't get a negative spike - The `[5m]` tells how far to look back if there is a gap in the data - And we multiply with `100*` to get CPU % usage .debug[[k8s/prometheus.md](https://github.com/BretFisher/kubernetes-mastery/tree/mastery/slides/k8s/prometheus.md)] --- ## Aggregation operators This query sums the CPU usage per node: ``` sum by (instance) ( irate(container_cpu_usage_seconds_total{pod_name=~"worker.*"}[5m]) ) ``` - `instance` corresponds to the node on which the container is running - `sum by (instance) (...)` computes the sum for each instance - Note: all the other tags are collapsed (in other words, the resulting graph only shows the `instance` tag) - PromQL supports many more [aggregation operators](https://prometheus.io/docs/prometheus/latest/querying/operators/#aggregation-operators) .debug[[k8s/prometheus.md](https://github.com/BretFisher/kubernetes-mastery/tree/mastery/slides/k8s/prometheus.md)] --- ## What kind of metrics can we collect? - Node metrics (related to physical or virtual machines) - Container metrics (resource usage per container) - Databases, message queues, load balancers, ... (check out this [list of exporters](https://prometheus.io/docs/instrumenting/exporters/)!) - Instrumentation (=deluxe `printf` for our code) - Business metrics (customers served, revenue, ...) .debug[[k8s/prometheus.md](https://github.com/BretFisher/kubernetes-mastery/tree/mastery/slides/k8s/prometheus.md)] --- class: extra-details ## Node metrics - CPU, RAM, disk usage on the whole node - Total number of processes running, and their states - Number of open files, sockets, and their states - I/O activity (disk, network), per operation or volume - Physical/hardware (when applicable): temperature, fan speed... - ...and much more! .debug[[k8s/prometheus.md](https://github.com/BretFisher/kubernetes-mastery/tree/mastery/slides/k8s/prometheus.md)] --- class: extra-details ## Container metrics - Similar to node metrics, but not totally identical - RAM breakdown will be different - active vs inactive memory - some memory is *shared* between containers, and specially accounted for - I/O activity is also harder to track - async writes can cause deferred "charges" - some page-ins are also shared between containers For details about container metrics, see: <br/> http://jpetazzo.github.io/2013/10/08/docker-containers-metrics/ .debug[[k8s/prometheus.md](https://github.com/BretFisher/kubernetes-mastery/tree/mastery/slides/k8s/prometheus.md)] --- class: extra-details ## Application metrics - Arbitrary metrics related to your application and business - System performance: request latency, error rate... - Volume information: number of rows in database, message queue size... - Business data: inventory, items sold, revenue... .debug[[k8s/prometheus.md](https://github.com/BretFisher/kubernetes-mastery/tree/mastery/slides/k8s/prometheus.md)] --- class: extra-details ## Detecting scrape targets - Prometheus can leverage Kubernetes service discovery (with proper configuration) - Services or pods can be annotated with: - `prometheus.io/scrape: true` to enable scraping - `prometheus.io/port: 9090` to indicate the port number - `prometheus.io/path: /metrics` to indicate the URI (`/metrics` by default) - Prometheus will detect and scrape these (without needing a restart or reload) .debug[[k8s/prometheus.md](https://github.com/BretFisher/kubernetes-mastery/tree/mastery/slides/k8s/prometheus.md)] --- ## Querying labels - What if we want to get metrics for containers belonging to a pod tagged `worker`? - The cAdvisor exporter does not give us Kubernetes labels - Kubernetes labels are exposed through another exporter - We can see Kubernetes labels through metrics `kube_pod_labels` (each container appears as a time series with constant value of `1`) - Prometheus *kind of* supports "joins" between time series - But only if the names of the tags match exactly .debug[[k8s/prometheus.md](https://github.com/BretFisher/kubernetes-mastery/tree/mastery/slides/k8s/prometheus.md)] --- ## Unfortunately ... - The cAdvisor exporter uses tag `pod_name` for the name of a pod - The Kubernetes service endpoints exporter uses tag `pod` instead - See [this blog post](https://www.robustperception.io/exposing-the-software-version-to-prometheus) or [this other one](https://www.weave.works/blog/aggregating-pod-resource-cpu-memory-usage-arbitrary-labels-prometheus/) to see how to perform "joins" - Alas, Prometheus cannot "join" time series with different labels (see [Prometheus issue #2204](https://github.com/prometheus/prometheus/issues/2204) for the rationale) - There is a workaround involving relabeling, but it's "not cheap" - see [this comment](https://github.com/prometheus/prometheus/issues/2204#issuecomment-261515520) for an overview - or [this blog post](https://5pi.de/2017/11/09/use-prometheus-vector-matching-to-get-kubernetes-utilization-across-any-pod-label/) for a complete description of the process .debug[[k8s/prometheus.md](https://github.com/BretFisher/kubernetes-mastery/tree/mastery/slides/k8s/prometheus.md)] --- ## In practice - Grafana is a beautiful (and useful) frontend to display all kinds of graphs - Not everyone needs to know Prometheus, PromQL, Grafana, etc. - But in a team, it is valuable to have at least one person who know them - That person can set up queries and dashboards for the rest of the team - It's a little bit like knowing how to optimize SQL queries, Dockerfiles... Don't panic if you don't know these tools! ...But make sure at least one person in your team is on it 💯 .debug[[k8s/prometheus.md](https://github.com/BretFisher/kubernetes-mastery/tree/mastery/slides/k8s/prometheus.md)] --- class: pic .interstitial[] --- name: toc-resource-limits class: title Resource Limits .nav[ [Previous section](#toc-collecting-metrics-with-prometheus) | [Back to table of contents](#toc-chapter-11) | [Next section](#toc-defining-min-max-and-default-resources) ] .debug[(automatically generated title slide)] --- # Resource Limits - We can attach resource indications to our pods (or rather: to the *containers* in our pods) - We can specify *limits* and/or *requests* - We can specify quantities of CPU and/or memory .debug[[k8s/resource-limits.md](https://github.com/BretFisher/kubernetes-mastery/tree/mastery/slides/k8s/resource-limits.md)] --- ## CPU vs memory - CPU is a *compressible resource* (it can be preempted immediately without adverse effect) - Memory is an *incompressible resource* (it needs to be swapped out to be reclaimed; and this is costly) - As a result, exceeding limits will have different consequences for CPU and memory .debug[[k8s/resource-limits.md](https://github.com/BretFisher/kubernetes-mastery/tree/mastery/slides/k8s/resource-limits.md)] --- ## Exceeding CPU limits - CPU can be reclaimed instantaneously (in fact, it is preempted hundreds of times per second, at each context switch) - If a container uses too much CPU, it can be throttled (it will be scheduled less often) - The processes in that container will run slower (or rather: they will not run faster) .debug[[k8s/resource-limits.md](https://github.com/BretFisher/kubernetes-mastery/tree/mastery/slides/k8s/resource-limits.md)] --- ## Exceeding memory limits - Memory needs to be swapped out before being reclaimed - "Swapping" means writing memory pages to disk, which is very slow - On a classic system, a process that swaps can get 1000x slower (because disk I/O is 1000x slower than memory I/O) - Exceeding the memory limit (even by a small amount) can reduce performance *a lot* - Kubernetes *does not support swap* (more on that later!) - Exceeding the memory limit will cause the container to be killed .debug[[k8s/resource-limits.md](https://github.com/BretFisher/kubernetes-mastery/tree/mastery/slides/k8s/resource-limits.md)] --- ## Limits vs requests - Limits are "hard limits" (they can't be exceeded) - a container exceeding its memory limit is killed - a container exceeding its CPU limit is throttled - Requests are used for scheduling purposes - a container using *less* than what it requested will never be killed or throttled - the scheduler uses the requested sizes to determine placement - the resources requested by all pods on a node will never exceed the node size .debug[[k8s/resource-limits.md](https://github.com/BretFisher/kubernetes-mastery/tree/mastery/slides/k8s/resource-limits.md)] --- ## Pod quality of service Each pod is assigned a QoS class (visible in `status.qosClass`). - If limits = requests: - as long as the container uses less than the limit, it won't be affected - if all containers in a pod have *(limits=requests)*, QoS is considered "Guaranteed" - If requests < limits: - as long as the container uses less than the request, it won't be affected - otherwise, it might be killed/evicted if the node gets overloaded - if at least one container has *(requests<limits)*, QoS is considered "Burstable" - If a pod doesn't have any request nor limit, QoS is considered "BestEffort" .debug[[k8s/resource-limits.md](https://github.com/BretFisher/kubernetes-mastery/tree/mastery/slides/k8s/resource-limits.md)] --- ## Quality of service impact - When a node is overloaded, BestEffort pods are killed first - Then, Burstable pods that exceed their limits - Burstable and Guaranteed pods below their limits are never killed (except if their node fails) - If we only use Guaranteed pods, no pod should ever be killed (as long as they stay within their limits) (Pod QoS is also explained in [this page](https://kubernetes.io/docs/tasks/configure-pod-container/quality-service-pod/) of the Kubernetes documentation and in [this blog post](https://medium.com/google-cloud/quality-of-service-class-qos-in-kubernetes-bb76a89eb2c6).) .debug[[k8s/resource-limits.md](https://github.com/BretFisher/kubernetes-mastery/tree/mastery/slides/k8s/resource-limits.md)] --- ## Where is my swap? - The semantics of memory and swap limits on Linux cgroups are complex - In particular, it's not possible to disable swap for a cgroup (the closest option is to [reduce "swappiness"](https://unix.stackexchange.com/questions/77939/turning-off-swapping-for-only-one-process-with-cgroups)) - The architects of Kubernetes wanted to ensure that Guaranteed pods never swap - The only solution was to disable swap entirely .debug[[k8s/resource-limits.md](https://github.com/BretFisher/kubernetes-mastery/tree/mastery/slides/k8s/resource-limits.md)] --- ## Alternative point of view - Swap enables paging¹ of anonymous² memory - Even when swap is disabled, Linux will still page memory for: - executables, libraries - mapped files - Disabling swap *will reduce performance and available resources* - For a good time, read [kubernetes/kubernetes#53533](https://github.com/kubernetes/kubernetes/issues/53533) - Also read this [excellent blog post about swap](https://jvns.ca/blog/2017/02/17/mystery-swap/) ¹Paging: reading/writing memory pages from/to disk to reclaim physical memory ²Anonymous memory: memory that is not backed by files or blocks .debug[[k8s/resource-limits.md](https://github.com/BretFisher/kubernetes-mastery/tree/mastery/slides/k8s/resource-limits.md)] --- ## Enabling swap anyway - If you don't care that pods are swapping, you can enable swap - You will need to add the flag `--fail-swap-on=false` to kubelet (otherwise, it won't start!) .debug[[k8s/resource-limits.md](https://github.com/BretFisher/kubernetes-mastery/tree/mastery/slides/k8s/resource-limits.md)] --- ## Specifying resources - Resource requests are expressed at the *container* level - CPU is expressed in "virtual CPUs" (corresponding to the virtual CPUs offered by some cloud providers) - CPU can be expressed with a decimal value, or even a "milli" suffix (so 100m = 0.1) - Memory is expressed in bytes - Memory can be expressed with k, M, G, T, ki, Mi, Gi, Ti suffixes (corresponding to 10^3, 10^6, 10^9, 10^12, 2^10, 2^20, 2^30, 2^40) .debug[[k8s/resource-limits.md](https://github.com/BretFisher/kubernetes-mastery/tree/mastery/slides/k8s/resource-limits.md)] --- ## Specifying resources in practice This is what the spec of a Pod with resources will look like: ```yaml containers: - name: httpenv image: jpetazzo/httpenv resources: limits: memory: "100Mi" cpu: "100m" requests: memory: "100Mi" cpu: "10m" ``` This set of resources makes sure that this service won't be killed (as long as it stays below 100 MB of RAM), but allows its CPU usage to be throttled if necessary. .debug[[k8s/resource-limits.md](https://github.com/BretFisher/kubernetes-mastery/tree/mastery/slides/k8s/resource-limits.md)] --- ## Default values - If we specify a limit without a request: the request is set to the limit - If we specify a request without a limit: there will be no limit (which means that the limit will be the size of the node) - If we don't specify anything: the request is zero and the limit is the size of the node *Unless there are default values defined for our namespace!* .debug[[k8s/resource-limits.md](https://github.com/BretFisher/kubernetes-mastery/tree/mastery/slides/k8s/resource-limits.md)] --- ## We need default resource values - If we do not set resource values at all: - the limit is "the size of the node" - the request is zero - This is generally *not* what we want - a container without a limit can use up all the resources of a node - if the request is zero, the scheduler can't make a smart placement decision - To address this, we can set default values for resources - This is done with a LimitRange object .debug[[k8s/resource-limits.md](https://github.com/BretFisher/kubernetes-mastery/tree/mastery/slides/k8s/resource-limits.md)] --- class: pic .interstitial[] --- name: toc-defining-min-max-and-default-resources class: title Defining min, max, and default resources .nav[ [Previous section](#toc-resource-limits) | [Back to table of contents](#toc-chapter-11) | [Next section](#toc-namespace-quotas) ] .debug[(automatically generated title slide)] --- # Defining min, max, and default resources - We can create LimitRange objects to indicate any combination of: - min and/or max resources allowed per pod - default resource *limits* - default resource *requests* - maximal burst ratio (*limit/request*) - LimitRange objects are namespaced - They apply to their namespace only .debug[[k8s/resource-limits.md](https://github.com/BretFisher/kubernetes-mastery/tree/mastery/slides/k8s/resource-limits.md)] --- ## LimitRange example ```yaml apiVersion: v1 kind: LimitRange metadata: name: my-very-detailed-limitrange spec: limits: - type: Container min: cpu: "100m" max: cpu: "2000m" memory: "1Gi" default: cpu: "500m" memory: "250Mi" defaultRequest: cpu: "500m" ``` .debug[[k8s/resource-limits.md](https://github.com/BretFisher/kubernetes-mastery/tree/mastery/slides/k8s/resource-limits.md)] --- ## Example explanation The YAML on the previous slide shows an example LimitRange object specifying very detailed limits on CPU usage, and providing defaults on RAM usage. Note the `type: Container` line: in the future, it might also be possible to specify limits per Pod, but it's not [officially documented yet](https://github.com/kubernetes/website/issues/9585). .debug[[k8s/resource-limits.md](https://github.com/BretFisher/kubernetes-mastery/tree/mastery/slides/k8s/resource-limits.md)] --- ## LimitRange details - LimitRange restrictions are enforced only when a Pod is created (they don't apply retroactively) - They don't prevent creation of e.g. an invalid Deployment or DaemonSet (but the pods will not be created as long as the LimitRange is in effect) - If there are multiple LimitRange restrictions, they all apply together (which means that it's possible to specify conflicting LimitRanges, <br/>preventing any Pod from being created) - If a LimitRange specifies a `max` for a resource but no `default`, <br/>that `max` value becomes the `default` limit too .debug[[k8s/resource-limits.md](https://github.com/BretFisher/kubernetes-mastery/tree/mastery/slides/k8s/resource-limits.md)] --- class: pic .interstitial[] --- name: toc-namespace-quotas class: title Namespace quotas .nav[ [Previous section](#toc-defining-min-max-and-default-resources) | [Back to table of contents](#toc-chapter-11) | [Next section](#toc-limiting-resources-in-practice) ] .debug[(automatically generated title slide)] --- # Namespace quotas - We can also set quotas per namespace - Quotas apply to the total usage in a namespace (e.g. total CPU limits of all pods in a given namespace) - Quotas can apply to resource limits and/or requests (like the CPU and memory limits that we saw earlier) - Quotas can also apply to other resources: - "extended" resources (like GPUs) - storage size - number of objects (number of pods, services...) .debug[[k8s/resource-limits.md](https://github.com/BretFisher/kubernetes-mastery/tree/mastery/slides/k8s/resource-limits.md)] --- ## Creating a quota for a namespace - Quotas are enforced by creating a ResourceQuota object - ResourceQuota objects are namespaced, and apply to their namespace only - We can have multiple ResourceQuota objects in the same namespace - The most restrictive values are used .debug[[k8s/resource-limits.md](https://github.com/BretFisher/kubernetes-mastery/tree/mastery/slides/k8s/resource-limits.md)] --- ## Limiting total CPU/memory usage - The following YAML specifies an upper bound for *limits* and *requests*: ```yaml apiVersion: v1 kind: ResourceQuota metadata: name: a-little-bit-of-compute spec: hard: requests.cpu: "10" requests.memory: 10Gi limits.cpu: "20" limits.memory: 20Gi ``` These quotas will apply to the namespace where the ResourceQuota is created. .debug[[k8s/resource-limits.md](https://github.com/BretFisher/kubernetes-mastery/tree/mastery/slides/k8s/resource-limits.md)] --- ## Limiting number of objects - The following YAML specifies how many objects of specific types can be created: ```yaml apiVersion: v1 kind: ResourceQuota metadata: name: quota-for-objects spec: hard: pods: 100 services: 10 secrets: 10 configmaps: 10 persistentvolumeclaims: 20 services.nodeports: 0 services.loadbalancers: 0 count/roles.rbac.authorization.k8s.io: 10 ``` (The `count/` syntax allows limiting arbitrary objects, including CRDs.) .debug[[k8s/resource-limits.md](https://github.com/BretFisher/kubernetes-mastery/tree/mastery/slides/k8s/resource-limits.md)] --- ## YAML vs CLI - Quotas can be created with a YAML definition - ...Or with the `kubectl create quota` command - Example: ```bash kubectl create quota my-resource-quota --hard=pods=300,limits.memory=300Gi ``` - With both YAML and CLI form, the values are always under the `hard` section (there is no `soft` quota) .debug[[k8s/resource-limits.md](https://github.com/BretFisher/kubernetes-mastery/tree/mastery/slides/k8s/resource-limits.md)] --- ## Viewing current usage When a ResourceQuota is created, we can see how much of it is used: ``` kubectl describe resourcequota my-resource-quota Name: my-resource-quota Namespace: default Resource Used Hard -------- ---- ---- pods 12 100 services 1 5 services.loadbalancers 0 0 services.nodeports 0 0 ``` .debug[[k8s/resource-limits.md](https://github.com/BretFisher/kubernetes-mastery/tree/mastery/slides/k8s/resource-limits.md)] --- ## Advanced quotas and PriorityClass - Since Kubernetes 1.12, it is possible to create PriorityClass objects - Pods can be assigned a PriorityClass - Quotas can be linked to a PriorityClass - This allows us to reserve resources for pods within a namespace - For more details, check [this documentation page](https://kubernetes.io/docs/concepts/policy/resource-quotas/#resource-quota-per-priorityclass) .debug[[k8s/resource-limits.md](https://github.com/BretFisher/kubernetes-mastery/tree/mastery/slides/k8s/resource-limits.md)] --- class: pic .interstitial[] --- name: toc-limiting-resources-in-practice class: title Limiting resources in practice .nav[ [Previous section](#toc-namespace-quotas) | [Back to table of contents](#toc-chapter-11) | [Next section](#toc-checking-pod-and-node-resource-usage) ] .debug[(automatically generated title slide)] --- # Limiting resources in practice - We have at least three mechanisms: - requests and limits per Pod - LimitRange per namespace - ResourceQuota per namespace - Let's see a simple recommendation to get started with resource limits .debug[[k8s/resource-limits.md](https://github.com/BretFisher/kubernetes-mastery/tree/mastery/slides/k8s/resource-limits.md)] --- ## Set a LimitRange - In each namespace, create a LimitRange object - Set a small default CPU request and CPU limit (e.g. "100m") - Set a default memory request and limit depending on your most common workload - for Java, Ruby: start with "1G" - for Go, Python, PHP, Node: start with "250M" - Set upper bounds slightly below your expected node size (80-90% of your node size, with at least a 500M memory buffer) .debug[[k8s/resource-limits.md](https://github.com/BretFisher/kubernetes-mastery/tree/mastery/slides/k8s/resource-limits.md)] --- ## Set a ResourceQuota - In each namespace, create a ResourceQuota object - Set generous CPU and memory limits (e.g. half the cluster size if the cluster hosts multiple apps) - Set generous objects limits - these limits should not be here to constrain your users - they should catch a runaway process creating many resources - example: a custom controller creating many pods .debug[[k8s/resource-limits.md](https://github.com/BretFisher/kubernetes-mastery/tree/mastery/slides/k8s/resource-limits.md)] --- ## Observe, refine, iterate - Observe the resource usage of your pods (we will see how in the next chapter) - Adjust individual pod limits - If you see trends: adjust the LimitRange (rather than adjusting every individual set of pod limits) - Observe the resource usage of your namespaces (with `kubectl describe resourcequota ...`) - Rinse and repeat regularly .debug[[k8s/resource-limits.md](https://github.com/BretFisher/kubernetes-mastery/tree/mastery/slides/k8s/resource-limits.md)] --- ## Additional resources - [A Practical Guide to Setting Kubernetes Requests and Limits](http://blog.kubecost.com/blog/requests-and-limits/) - explains what requests and limits are - provides guidelines to set requests and limits - gives PromQL expressions to compute good values <br/>(our app needs to be running for a while) - [Kube Resource Report](https://github.com/hjacobs/kube-resource-report/) - generates web reports on resource usage - [static demo](https://hjacobs.github.io/kube-resource-report/sample-report/output/index.html) | [live demo](https://kube-resource-report.demo.j-serv.de/applications.html) .debug[[k8s/resource-limits.md](https://github.com/BretFisher/kubernetes-mastery/tree/mastery/slides/k8s/resource-limits.md)] --- class: pic .interstitial[] --- name: toc-checking-pod-and-node-resource-usage class: title Checking pod and node resource usage .nav[ [Previous section](#toc-limiting-resources-in-practice) | [Back to table of contents](#toc-chapter-11) | [Next section](#toc-cluster-sizing) ] .debug[(automatically generated title slide)] --- # Checking pod and node resource usage - Since Kubernetes 1.8, metrics are collected by the [resource metrics pipeline](https://kubernetes.io/docs/tasks/debug-application-cluster/resource-metrics-pipeline/) - The resource metrics pipeline is: - optional (Kubernetes can function without it) - necessary for some features (like the Horizontal Pod Autoscaler) - exposed through the Kubernetes API using the [aggregation layer](https://kubernetes.io/docs/concepts/extend-kubernetes/api-extension/apiserver-aggregation/) - usually implemented by the "metrics server" .debug[[k8s/metrics-server.md](https://github.com/BretFisher/kubernetes-mastery/tree/mastery/slides/k8s/metrics-server.md)] --- ## How to know if the metrics server is running? - The easiest way to know is to run `kubectl top` .exercise[ - Check if the core metrics pipeline is available: ```bash kubectl top nodes ``` ] If it shows our nodes and their CPU and memory load, we're good! .debug[[k8s/metrics-server.md](https://github.com/BretFisher/kubernetes-mastery/tree/mastery/slides/k8s/metrics-server.md)] --- ## Installing metrics server - The metrics server doesn't have any particular requirements (it doesn't need persistence, as it doesn't *store* metrics) - It has its own repository, [kubernetes-incubator/metrics-server](https://github.com/kubernetes-incubator/metrics-server) - The repository comes with [YAML files for deployment](https://github.com/kubernetes-incubator/metrics-server/tree/master/deploy/1.8%2B) - These files may not work on some clusters (e.g. if your node names are not in DNS) - The container.training repository has a [metrics-server.yaml](https://github.com/jpetazzo/container.training/blob/master/k8s/metrics-server.yaml#L90) file to help with that (we can `kubectl apply -f` that file if needed) .debug[[k8s/metrics-server.md](https://github.com/BretFisher/kubernetes-mastery/tree/mastery/slides/k8s/metrics-server.md)] --- ## Showing container resource usage - Once the metrics server is running, we can check container resource usage .exercise[ - Show resource usage across all containers: ```bash kubectl top pods --containers --all-namespaces ``` ] - We can also use selectors (`-l app=...`) .debug[[k8s/metrics-server.md](https://github.com/BretFisher/kubernetes-mastery/tree/mastery/slides/k8s/metrics-server.md)] --- ## Other tools - kube-capacity is a great CLI tool to view resources (https://github.com/robscott/kube-capacity) - It can show resource and limits, and compare them with usage - It can show utilization per node, or per pod - kube-resource-report can generate HTML reports (https://github.com/hjacobs/kube-resource-report) .debug[[k8s/metrics-server.md](https://github.com/BretFisher/kubernetes-mastery/tree/mastery/slides/k8s/metrics-server.md)] --- class: pic .interstitial[] --- name: toc-cluster-sizing class: title Cluster sizing .nav[ [Previous section](#toc-checking-pod-and-node-resource-usage) | [Back to table of contents](#toc-chapter-11) | [Next section](#toc-the-horizontal-pod-autoscaler) ] .debug[(automatically generated title slide)] --- # Cluster sizing - What happens when the cluster gets full? - How can we scale up the cluster? - Can we do it automatically? - What are other methods to address capacity planning? .debug[[k8s/cluster-sizing.md](https://github.com/BretFisher/kubernetes-mastery/tree/mastery/slides/k8s/cluster-sizing.md)] --- ## When are we out of resources? - kubelet monitors node resources: - memory - node disk usage (typically the root filesystem of the node) - image disk usage (where container images and RW layers are stored) - For each resource, we can provide two thresholds: - a hard threshold (if it's met, it provokes immediate action) - a soft threshold (provokes action only after a grace period) - Resource thresholds and grace periods are configurable (by passing kubelet command-line flags) .debug[[k8s/cluster-sizing.md](https://github.com/BretFisher/kubernetes-mastery/tree/mastery/slides/k8s/cluster-sizing.md)] --- ## What happens then? - If disk usage is too high: - kubelet will try to remove terminated pods - then, it will try to *evict* pods - If memory usage is too high: - it will try to evict pods - The node is marked as "under pressure" - This temporarily prevents new pods from being scheduled on the node .debug[[k8s/cluster-sizing.md](https://github.com/BretFisher/kubernetes-mastery/tree/mastery/slides/k8s/cluster-sizing.md)] --- ## Which pods get evicted? - kubelet looks at the pods' QoS and PriorityClass - First, pods with BestEffort QoS are considered - Then, pods with Burstable QoS exceeding their *requests* (but only if the exceeding resource is the one that is low on the node) - Finally, pods with Guaranteed QoS, and Burstable pods within their requests - Within each group, pods are sorted by PriorityClass - If there are pods with the same PriorityClass, they are sorted by usage excess (i.e. the pods whose usage exceeds their requests the most are evicted first) .debug[[k8s/cluster-sizing.md](https://github.com/BretFisher/kubernetes-mastery/tree/mastery/slides/k8s/cluster-sizing.md)] --- class: extra-details ## Eviction of Guaranteed pods - *Normally*, pods with Guaranteed QoS should not be evicted - A chunk of resources is reserved for node processes (like kubelet) - It is expected that these processes won't use more than this reservation - If they do use more resources anyway, all bets are off! - If this happens, kubelet must evict Guaranteed pods to preserve node stability (or Burstable pods that are still within their requested usage) .debug[[k8s/cluster-sizing.md](https://github.com/BretFisher/kubernetes-mastery/tree/mastery/slides/k8s/cluster-sizing.md)] --- ## What happens to evicted pods? - The pod is terminated - It is marked as `Failed` at the API level - If the pod was created by a controller, the controller will recreate it - The pod will be recreated on another node, *if there are resources available!* - For more details about the eviction process, see: - [this documentation page](https://kubernetes.io/docs/tasks/administer-cluster/out-of-resource/) about resource pressure and pod eviction, - [this other documentation page](https://kubernetes.io/docs/concepts/configuration/pod-priority-preemption/) about pod priority and preemption. .debug[[k8s/cluster-sizing.md](https://github.com/BretFisher/kubernetes-mastery/tree/mastery/slides/k8s/cluster-sizing.md)] --- ## What if there are no resources available? - Sometimes, a pod cannot be scheduled anywhere: - all the nodes are under pressure, - or the pod requests more resources than are available - The pod then remains in `Pending` state until the situation improves .debug[[k8s/cluster-sizing.md](https://github.com/BretFisher/kubernetes-mastery/tree/mastery/slides/k8s/cluster-sizing.md)] --- ## Cluster scaling - One way to improve the situation is to add new nodes - This can be done automatically with the [Cluster Autoscaler](https://github.com/kubernetes/autoscaler/tree/master/cluster-autoscaler) - The autoscaler will automatically scale up: - if there are pods that failed to be scheduled - The autoscaler will automatically scale down: - if nodes have a low utilization for an extended period of time .debug[[k8s/cluster-sizing.md](https://github.com/BretFisher/kubernetes-mastery/tree/mastery/slides/k8s/cluster-sizing.md)] --- ## Restrictions, gotchas ... - The Cluster Autoscaler only supports a few cloud infrastructures (see [here](https://github.com/kubernetes/autoscaler/tree/master/cluster-autoscaler/cloudprovider) for a list) - The Cluster Autoscaler cannot scale down nodes that have pods using: - local storage - affinity/anti-affinity rules preventing them from being rescheduled - a restrictive PodDisruptionBudget .debug[[k8s/cluster-sizing.md](https://github.com/BretFisher/kubernetes-mastery/tree/mastery/slides/k8s/cluster-sizing.md)] --- ## Other way to do capacity planning - "Running Kubernetes without nodes" - Systems like [Virtual Kubelet](https://virtual-kubelet.io/) or [Kiyot](https://static.elotl.co/docs/latest/kiyot/kiyot.html) can run pods using on-demand resources - Virtual Kubelet can leverage e.g. ACI or Fargate to run pods - Kiyot runs pods in ad-hoc EC2 instances (1 instance per pod) - Economic advantage (no wasted capacity) - Security advantage (stronger isolation between pods) Check [this blog post](http://jpetazzo.github.io/2019/02/13/running-kubernetes-without-nodes-with-kiyot/) for more details. .debug[[k8s/cluster-sizing.md](https://github.com/BretFisher/kubernetes-mastery/tree/mastery/slides/k8s/cluster-sizing.md)] --- class: pic .interstitial[] --- name: toc-the-horizontal-pod-autoscaler class: title The Horizontal Pod Autoscaler .nav[ [Previous section](#toc-cluster-sizing) | [Back to table of contents](#toc-chapter-11) | [Next section](#toc-extending-the-kubernetes-api) ] .debug[(automatically generated title slide)] --- # The Horizontal Pod Autoscaler - What is the Horizontal Pod Autoscaler, or HPA? - It is a controller that can perform *horizontal* scaling automatically - Horizontal scaling = changing the number of replicas (adding/removing pods) - Vertical scaling = changing the size of individual replicas (increasing/reducing CPU and RAM per pod) - Cluster scaling = changing the size of the cluster (adding/removing nodes) .debug[[k8s/horizontal-pod-autoscaler.md](https://github.com/BretFisher/kubernetes-mastery/tree/mastery/slides/k8s/horizontal-pod-autoscaler.md)] --- ## Principle of operation - Each HPA resource (or "policy") specifies: - which object to monitor and scale (e.g. a Deployment, ReplicaSet...) - min/max scaling ranges (the max is a safety limit!) - a target resource usage (e.g. the default is CPU=80%) - The HPA continuously monitors the CPU usage for the related object - It computes how many pods should be running: `TargetNumOfPods = ceil(sum(CurrentPodsCPUUtilization) / Target)` - It scales the related object up/down to this target number of pods .debug[[k8s/horizontal-pod-autoscaler.md](https://github.com/BretFisher/kubernetes-mastery/tree/mastery/slides/k8s/horizontal-pod-autoscaler.md)] --- ## Pre-requirements - The metrics server needs to be running (i.e. we need to be able to see pod metrics with `kubectl top pods`) - The pods that we want to autoscale need to have resource requests (because the target CPU% is not absolute, but relative to the request) - The latter actually makes a lot of sense: - if a Pod doesn't have a CPU request, it might be using 10% of CPU... - ...but only because there is no CPU time available! - this makes sure that we won't add pods to nodes that are already resource-starved .debug[[k8s/horizontal-pod-autoscaler.md](https://github.com/BretFisher/kubernetes-mastery/tree/mastery/slides/k8s/horizontal-pod-autoscaler.md)] --- ## Testing the HPA - We will start a CPU-intensive web service - We will send some traffic to that service - We will create an HPA policy - The HPA will automatically scale up the service for us .debug[[k8s/horizontal-pod-autoscaler.md](https://github.com/BretFisher/kubernetes-mastery/tree/mastery/slides/k8s/horizontal-pod-autoscaler.md)] --- ## A CPU-intensive web service - Let's use `jpetazzo/busyhttp` (it is a web server that will use 1s of CPU for each HTTP request) .exercise[ - Deploy the web server: ```bash kubectl create deployment busyhttp --image=jpetazzo/busyhttp ``` - Expose it with a ClusterIP service: ```bash kubectl expose deployment busyhttp --port=80 ``` - Get the ClusterIP allocated to the service: ```bash kubectl get svc busyhttp ``` ] .debug[[k8s/horizontal-pod-autoscaler.md](https://github.com/BretFisher/kubernetes-mastery/tree/mastery/slides/k8s/horizontal-pod-autoscaler.md)] --- ## Monitor what's going on - Let's start a bunch of commands to watch what is happening .exercise[ - Monitor pod CPU usage: ```bash watch kubectl top pods -l app=busyhttp ``` <!-- ```wait NAME``` ```tmux split-pane -v``` ```bash CLUSTERIP=$(kubectl get svc busyhttp -o jsonpath={.spec.clusterIP})``` --> - Monitor service latency: ```bash httping http://`$CLUSTERIP`/ ``` <!-- ```wait connected to``` ```tmux split-pane -v``` --> - Monitor cluster events: ```bash kubectl get events -w ``` <!-- ```wait Normal``` ```tmux split-pane -v``` ```bash CLUSTERIP=$(kubectl get svc busyhttp -o jsonpath={.spec.clusterIP})``` --> ] .debug[[k8s/horizontal-pod-autoscaler.md](https://github.com/BretFisher/kubernetes-mastery/tree/mastery/slides/k8s/horizontal-pod-autoscaler.md)] --- ## Send traffic to the service - We will use `ab` (Apache Bench) to send traffic .exercise[ - Send a lot of requests to the service, with a concurrency level of 3: ```bash ab -c 3 -n 100000 http://`$CLUSTERIP`/ ``` <!-- ```wait be patient``` ```tmux split-pane -v``` ```tmux selectl even-vertical``` --> ] The latency (reported by `httping`) should increase above 3s. The CPU utilization should increase to 100%. (The server is single-threaded and won't go above 100%.) .debug[[k8s/horizontal-pod-autoscaler.md](https://github.com/BretFisher/kubernetes-mastery/tree/mastery/slides/k8s/horizontal-pod-autoscaler.md)] --- ## Create an HPA policy - There is a helper command to do that for us: `kubectl autoscale` .exercise[ - Create the HPA policy for the `busyhttp` deployment: ```bash kubectl autoscale deployment busyhttp --max=10 ``` ] By default, it will assume a target of 80% CPU usage. This can also be set with `--cpu-percent=`. -- *The autoscaler doesn't seem to work. Why?* .debug[[k8s/horizontal-pod-autoscaler.md](https://github.com/BretFisher/kubernetes-mastery/tree/mastery/slides/k8s/horizontal-pod-autoscaler.md)] --- ## What did we miss? - The events stream gives us a hint, but to be honest, it's not very clear: `missing request for cpu` - We forgot to specify a resource request for our Deployment! - The HPA target is not an absolute CPU% - It is relative to the CPU requested by the pod .debug[[k8s/horizontal-pod-autoscaler.md](https://github.com/BretFisher/kubernetes-mastery/tree/mastery/slides/k8s/horizontal-pod-autoscaler.md)] --- ## Adding a CPU request - Let's edit the deployment and add a CPU request - Since our server can use up to 1 core, let's request 1 core .exercise[ - Edit the Deployment definition: ```bash kubectl edit deployment busyhttp ``` <!-- ```wait Please edit``` ```keys /resources``` ```key ^J``` ```keys $xxxo requests:``` ```key ^J``` ```key Space``` ```key Space``` ```keys cpu: "1"``` ```key Escape``` ```keys :wq``` ```key ^J``` --> - In the `containers` list, add the following block: ```yaml resources: requests: cpu: "1" ``` ] .debug[[k8s/horizontal-pod-autoscaler.md](https://github.com/BretFisher/kubernetes-mastery/tree/mastery/slides/k8s/horizontal-pod-autoscaler.md)] --- ## Results - After saving and quitting, a rolling update happens (if `ab` or `httping` exits, make sure to restart it) - It will take a minute or two for the HPA to kick in: - the HPA runs every 30 seconds by default - it needs to gather metrics from the metrics server first - If we scale further up (or down), the HPA will react after a few minutes: - it won't scale up if it already scaled in the last 3 minutes - it won't scale down if it already scaled in the last 5 minutes .debug[[k8s/horizontal-pod-autoscaler.md](https://github.com/BretFisher/kubernetes-mastery/tree/mastery/slides/k8s/horizontal-pod-autoscaler.md)] --- ## What about other metrics? - The HPA in API group `autoscaling/v1` only supports CPU scaling - The HPA in API group `autoscaling/v2beta2` supports metrics from various API groups: - metrics.k8s.io, aka metrics server (per-Pod CPU and RAM) - custom.metrics.k8s.io, custom metrics per Pod - external.metrics.k8s.io, external metrics (not associated to Pods) - Kubernetes doesn't implement any of these API groups - Using these metrics requires [registering additional APIs](https://kubernetes.io/docs/tasks/run-application/horizontal-pod-autoscale/#support-for-metrics-apis) - The metrics provided by metrics server are standard; everything else is custom - For more details, see [this great blog post](https://medium.com/uptime-99/kubernetes-hpa-autoscaling-with-custom-and-external-metrics-da7f41ff7846) or [this talk](https://www.youtube.com/watch?v=gSiGFH4ZnS8) .debug[[k8s/horizontal-pod-autoscaler.md](https://github.com/BretFisher/kubernetes-mastery/tree/mastery/slides/k8s/horizontal-pod-autoscaler.md)] --- ## Cleanup - Since `busyhttp` uses CPU cycles, let's stop it before moving on .exercise[ - Delete the `busyhttp` Deployment: ```bash kubectl delete deployment busyhttp ``` <!-- ```key ^D``` ```key ^C``` ```key ^D``` ```key ^C``` ```key ^D``` ```key ^C``` ```key ^D``` ```key ^C``` --> ] .debug[[k8s/horizontal-pod-autoscaler.md](https://github.com/BretFisher/kubernetes-mastery/tree/mastery/slides/k8s/horizontal-pod-autoscaler.md)] --- class: pic .interstitial[] --- name: toc-extending-the-kubernetes-api class: title Extending the Kubernetes API .nav[ [Previous section](#toc-the-horizontal-pod-autoscaler) | [Back to table of contents](#toc-chapter-12) | [Next section](#toc-operators) ] .debug[(automatically generated title slide)] --- # Extending the Kubernetes API There are multiple ways to extend the Kubernetes API. We are going to cover: - Custom Resource Definitions (CRDs) - Admission Webhooks - The Aggregation Layer .debug[[k8s/extending-api.md](https://github.com/BretFisher/kubernetes-mastery/tree/mastery/slides/k8s/extending-api.md)] --- ## Revisiting the API server - The Kubernetes API server is a central point of the control plane (everything connects to it: controller manager, scheduler, kubelets) - Almost everything in Kubernetes is materialized by a resource - Resources have a type (or "kind") (similar to strongly typed languages) - We can see existing types with `kubectl api-resources` - We can list resources of a given type with `kubectl get <type>` .debug[[k8s/extending-api.md](https://github.com/BretFisher/kubernetes-mastery/tree/mastery/slides/k8s/extending-api.md)] --- ## Creating new types - We can create new types with Custom Resource Definitions (CRDs) - CRDs are created dynamically (without recompiling or restarting the API server) - CRDs themselves are resources: - we can create a new type with `kubectl create` and some YAML - we can see all our custom types with `kubectl get crds` - After we create a CRD, the new type works just like built-in types .debug[[k8s/extending-api.md](https://github.com/BretFisher/kubernetes-mastery/tree/mastery/slides/k8s/extending-api.md)] --- ## A very simple CRD The YAML below describes a very simple CRD representing different kinds of coffee: ```yaml apiVersion: apiextensions.k8s.io/v1alpha1 kind: CustomResourceDefinition metadata: name: coffees.container.training spec: group: container.training version: v1alpha1 scope: Namespaced names: plural: coffees singular: coffee kind: Coffee shortNames: - cof ``` .debug[[k8s/extending-api.md](https://github.com/BretFisher/kubernetes-mastery/tree/mastery/slides/k8s/extending-api.md)] --- ## Creating a CRD - Let's create the Custom Resource Definition for our Coffee resource .exercise[ - Load the CRD: ```bash kubectl apply -f ~/container.training/k8s/coffee-1.yaml ``` - Confirm that it shows up: ```bash kubectl get crds ``` ] .debug[[k8s/extending-api.md](https://github.com/BretFisher/kubernetes-mastery/tree/mastery/slides/k8s/extending-api.md)] --- ## Creating custom resources The YAML below defines a resource using the CRD that we just created: ```yaml kind: Coffee apiVersion: container.training/v1alpha1 metadata: name: arabica spec: taste: strong ``` .exercise[ - Create a few types of coffee beans: ```bash kubectl apply -f ~/container.training/k8s/coffees.yaml ``` ] .debug[[k8s/extending-api.md](https://github.com/BretFisher/kubernetes-mastery/tree/mastery/slides/k8s/extending-api.md)] --- ## Viewing custom resources - By default, `kubectl get` only shows name and age of custom resources .exercise[ - View the coffee beans that we just created: ```bash kubectl get coffees ``` ] - We can improve that, but it's outside the scope of this section! .debug[[k8s/extending-api.md](https://github.com/BretFisher/kubernetes-mastery/tree/mastery/slides/k8s/extending-api.md)] --- ## What can we do with CRDs? There are many possibilities! - *Operators* encapsulate complex sets of resources (e.g.: a PostgreSQL replicated cluster; an etcd cluster... <br/> see [awesome operators](https://github.com/operator-framework/awesome-operators) and [OperatorHub](https://operatorhub.io/) to find more) - Custom use-cases like [gitkube](https://gitkube.sh/) - creates a new custom type, `Remote`, exposing a git+ssh server - deploy by pushing YAML or Helm charts to that remote - Replacing built-in types with CRDs (see [this lightning talk by Tim Hockin](https://www.youtube.com/watch?v=ji0FWzFwNhA)) .debug[[k8s/extending-api.md](https://github.com/BretFisher/kubernetes-mastery/tree/mastery/slides/k8s/extending-api.md)] --- ## Little details - By default, CRDs are not *validated* (we can put anything we want in the `spec`) - When creating a CRD, we can pass an OpenAPI v3 schema (BETA!) (which will then be used to validate resources) - Generally, when creating a CRD, we also want to run a *controller* (otherwise nothing will happen when we create resources of that type) - The controller will typically *watch* our custom resources (and take action when they are created/updated) * Examples: [YAML to install the gitkube CRD](https://storage.googleapis.com/gitkube/gitkube-setup-stable.yaml), [YAML to install a redis operator CRD](https://github.com/amaizfinance/redis-operator/blob/master/deploy/crds/k8s_v1alpha1_redis_crd.yaml) * .debug[[k8s/extending-api.md](https://github.com/BretFisher/kubernetes-mastery/tree/mastery/slides/k8s/extending-api.md)] --- ## (Ab)using the API server - If we need to store something "safely" (as in: in etcd), we can use CRDs - This gives us primitives to read/write/list objects (and optionally validate them) - The Kubernetes API server can run on its own (without the scheduler, controller manager, and kubelets) - By loading CRDs, we can have it manage totally different objects (unrelated to containers, clusters, etc.) .debug[[k8s/extending-api.md](https://github.com/BretFisher/kubernetes-mastery/tree/mastery/slides/k8s/extending-api.md)] --- ## Service catalog - *Service catalog* is another extension mechanism - It's not extending the Kubernetes API strictly speaking (but it still provides new features!) - It doesn't create new types; it uses: - ClusterServiceBroker - ClusterServiceClass - ClusterServicePlan - ServiceInstance - ServiceBinding - It uses the Open service broker API .debug[[k8s/extending-api.md](https://github.com/BretFisher/kubernetes-mastery/tree/mastery/slides/k8s/extending-api.md)] --- ## Admission controllers - Admission controllers are another way to extend the Kubernetes API - Instead of creating new types, admission controllers can transform or vet API requests - The diagram on the next slide shows the path of an API request (courtesy of Banzai Cloud) .debug[[k8s/extending-api.md](https://github.com/BretFisher/kubernetes-mastery/tree/mastery/slides/k8s/extending-api.md)] --- class: pic  .debug[[k8s/extending-api.md](https://github.com/BretFisher/kubernetes-mastery/tree/mastery/slides/k8s/extending-api.md)] --- ## Types of admission controllers - *Validating* admission controllers can accept/reject the API call - *Mutating* admission controllers can modify the API request payload - Both types can also trigger additional actions (e.g. automatically create a Namespace if it doesn't exist) - There are a number of built-in admission controllers (see [documentation](https://kubernetes.io/docs/reference/access-authn-authz/admission-controllers/#what-does-each-admission-controller-do) for a list) - We can also dynamically define and register our own .debug[[k8s/extending-api.md](https://github.com/BretFisher/kubernetes-mastery/tree/mastery/slides/k8s/extending-api.md)] --- class: extra-details ## Some built-in admission controllers - ServiceAccount: automatically adds a ServiceAccount to Pods that don't explicitly specify one - LimitRanger: applies resource constraints specified by LimitRange objects when Pods are created - NamespaceAutoProvision: automatically creates namespaces when an object is created in a non-existent namespace *Note: #1 and #2 are enabled by default; #3 is not.* .debug[[k8s/extending-api.md](https://github.com/BretFisher/kubernetes-mastery/tree/mastery/slides/k8s/extending-api.md)] --- ## Admission Webhooks - We can setup *admission webhooks* to extend the behavior of the API server - The API server will submit incoming API requests to these webhooks - These webhooks can be *validating* or *mutating* - Webhooks can be set up dynamically (without restarting the API server) - To setup a dynamic admission webhook, we create a special resource: a `ValidatingWebhookConfiguration` or a `MutatingWebhookConfiguration` - These resources are created and managed like other resources (i.e. `kubectl create`, `kubectl get`...) .debug[[k8s/extending-api.md](https://github.com/BretFisher/kubernetes-mastery/tree/mastery/slides/k8s/extending-api.md)] --- ## Webhook Configuration - A ValidatingWebhookConfiguration or MutatingWebhookConfiguration contains: - the address of the webhook - the authentication information to use with the webhook - a list of rules - The rules indicate for which objects and actions the webhook is triggered (to avoid e.g. triggering webhooks when setting up webhooks) .debug[[k8s/extending-api.md](https://github.com/BretFisher/kubernetes-mastery/tree/mastery/slides/k8s/extending-api.md)] --- ## The aggregation layer - We can delegate entire parts of the Kubernetes API to external servers - This is done by creating APIService resources (check them with `kubectl get apiservices`!) - The APIService resource maps a type (kind) and version to an external service - All requests concerning that type are sent (proxied) to the external service - This allows to have resources like CRDs, but that aren't stored in etcd - Example: `metrics-server` (storing live metrics in etcd would be extremely inefficient) - Requires significantly more work than CRDs! .debug[[k8s/extending-api.md](https://github.com/BretFisher/kubernetes-mastery/tree/mastery/slides/k8s/extending-api.md)] --- ## Documentation - [Custom Resource Definitions: when to use them](https://kubernetes.io/docs/concepts/extend-kubernetes/api-extension/custom-resources/) - [Custom Resources Definitions: how to use them](https://kubernetes.io/docs/tasks/access-kubernetes-api/custom-resources/custom-resource-definitions/) - [Service Catalog](https://kubernetes.io/docs/concepts/extend-kubernetes/service-catalog/) - [Built-in Admission Controllers](https://kubernetes.io/docs/reference/access-authn-authz/admission-controllers/) - [Dynamic Admission Controllers](https://kubernetes.io/docs/reference/access-authn-authz/extensible-admission-controllers/) - [Aggregation Layer](https://kubernetes.io/docs/concepts/extend-kubernetes/api-extension/apiserver-aggregation/) .debug[[k8s/extending-api.md](https://github.com/BretFisher/kubernetes-mastery/tree/mastery/slides/k8s/extending-api.md)] --- class: pic .interstitial[] --- name: toc-operators class: title Operators .nav[ [Previous section](#toc-extending-the-kubernetes-api) | [Back to table of contents](#toc-chapter-12) | [Next section](#toc-owners-and-dependents) ] .debug[(automatically generated title slide)] --- # Operators - Operators are one of the many ways to extend Kubernetes - We will define operators - We will see how they work - We will install a specific operator (for ElasticSearch) - We will use it to provision an ElasticSearch cluster .debug[[k8s/operators.md](https://github.com/BretFisher/kubernetes-mastery/tree/mastery/slides/k8s/operators.md)] --- ## What are operators? *An operator represents **human operational knowledge in software,** <br/> to reliably manage an application. — [CoreOS](https://coreos.com/blog/introducing-operators.html)* Examples: - Deploying and configuring replication with MySQL, PostgreSQL ... - Setting up Elasticsearch, Kafka, RabbitMQ, Zookeeper ... - Reacting to failures when intervention is needed - Scaling up and down these systems .debug[[k8s/operators.md](https://github.com/BretFisher/kubernetes-mastery/tree/mastery/slides/k8s/operators.md)] --- ## What are they made from? - Operators combine two things: - Custom Resource Definitions - controller code watching the corresponding resources and acting upon them - A given operator can define one or multiple CRDs - The controller code (control loop) typically runs within the cluster (running as a Deployment with 1 replica is a common scenario) - But it could also run elsewhere (nothing mandates that the code run on the cluster, as long as it has API access) .debug[[k8s/operators.md](https://github.com/BretFisher/kubernetes-mastery/tree/mastery/slides/k8s/operators.md)] --- ## Why use operators? - Kubernetes gives us Deployments, StatefulSets, Services ... - These mechanisms give us building blocks to deploy applications - They work great for services that are made of *N* identical containers (like stateless ones) - They also work great for some stateful applications like Consul, etcd ... (with the help of highly persistent volumes) - They're not enough for complex services: - where different containers have different roles - where extra steps have to be taken when scaling or replacing containers .debug[[k8s/operators.md](https://github.com/BretFisher/kubernetes-mastery/tree/mastery/slides/k8s/operators.md)] --- ## Use-cases for operators - Systems with primary/secondary replication Examples: MariaDB, MySQL, PostgreSQL, Redis ... - Systems where different groups of nodes have different roles Examples: ElasticSearch, MongoDB ... - Systems with complex dependencies (that are themselves managed with operators) Examples: Flink or Kafka, which both depend on Zookeeper .debug[[k8s/operators.md](https://github.com/BretFisher/kubernetes-mastery/tree/mastery/slides/k8s/operators.md)] --- ## More use-cases - Representing and managing external resources (Example: [AWS Service Operator](https://operatorhub.io/operator/alpha/aws-service-operator.v0.0.1)) - Managing complex cluster add-ons (Example: [Istio operator](https://operatorhub.io/operator/beta/istio-operator.0.1.6)) - Deploying and managing our applications' lifecycles (more on that later) .debug[[k8s/operators.md](https://github.com/BretFisher/kubernetes-mastery/tree/mastery/slides/k8s/operators.md)] --- ## How operators work - An operator creates one or more CRDs (i.e., it creates new "Kinds" of resources on our cluster) - The operator also runs a *controller* that will watch its resources - Each time we create/update/delete a resource, the controller is notified (we could write our own cheap controller with `kubectl get --watch`) .debug[[k8s/operators.md](https://github.com/BretFisher/kubernetes-mastery/tree/mastery/slides/k8s/operators.md)] --- ## One operator in action - We will install [Elastic Cloud on Kubernetes](https://www.elastic.co/guide/en/cloud-on-k8s/current/k8s-quickstart.html), an ElasticSearch operator - This operator requires PersistentVolumes - We will install Rancher's [local path storage provisioner](https://github.com/rancher/local-path-provisioner) to automatically create these - Then, we will create an ElasticSearch resource - The operator will detect that resource and provision the cluster .debug[[k8s/operators.md](https://github.com/BretFisher/kubernetes-mastery/tree/mastery/slides/k8s/operators.md)] --- ## Installing a Persistent Volume provisioner (This step can be skipped if you already have a dynamic volume provisioner.) - This provisioner creates Persistent Volumes backed by `hostPath` (local directories on our nodes) - It doesn't require anything special ... - ... But losing a node = losing the volumes on that node! .exercise[ - Install the local path storage provisioner: ```bash kubectl apply -f ~/container.training/k8s/local-path-storage.yaml ``` ] .debug[[k8s/operators.md](https://github.com/BretFisher/kubernetes-mastery/tree/mastery/slides/k8s/operators.md)] --- ## Making sure we have a default StorageClass - The ElasticSearch operator will create StatefulSets - These StatefulSets will instantiate PersistentVolumeClaims - These PVCs need to be explicitly associated with a StorageClass - Or we need to tag a StorageClass to be used as the default one .exercise[ - List StorageClasses: ```bash kubectl get storageclasses ``` ] We should see the `local-path` StorageClass. .debug[[k8s/operators.md](https://github.com/BretFisher/kubernetes-mastery/tree/mastery/slides/k8s/operators.md)] --- ## Setting a default StorageClass - This is done by adding an annotation to the StorageClass: `storageclass.kubernetes.io/is-default-class: true` .exercise[ - Tag the StorageClass so that it's the default one: ```bash kubectl annotate storageclass local-path \ storageclass.kubernetes.io/is-default-class=true ``` - Check the result: ```bash kubectl get storageclasses ``` ] Now, the StorageClass should have `(default)` next to its name. .debug[[k8s/operators.md](https://github.com/BretFisher/kubernetes-mastery/tree/mastery/slides/k8s/operators.md)] --- ## Install the ElasticSearch operator - The operator provides: - a few CustomResourceDefinitions - a Namespace for its other resources - a ValidatingWebhookConfiguration for type checking - a StatefulSet for its controller and webhook code - a ServiceAccount, ClusterRole, ClusterRoleBinding for permissions - All these resources are grouped in a convenient YAML file .exercise[ - Install the operator: ```bash kubectl apply -f ~/container.training/k8s/eck-operator.yaml ``` ] .debug[[k8s/operators.md](https://github.com/BretFisher/kubernetes-mastery/tree/mastery/slides/k8s/operators.md)] --- ## Check our new custom resources - Let's see which CRDs were created .exercise[ - List all CRDs: ```bash kubectl get crds ``` ] This operator supports ElasticSearch, but also Kibana and APM. Cool! .debug[[k8s/operators.md](https://github.com/BretFisher/kubernetes-mastery/tree/mastery/slides/k8s/operators.md)] --- ## Create the `eck-demo` namespace - For clarity, we will create everything in a new namespace, `eck-demo` - This namespace is hard-coded in the YAML files that we are going to use - We need to create that namespace .exercise[ - Create the `eck-demo` namespace: ```bash kubectl create namespace eck-demo ``` - Switch to that namespace: ```bash kns eck-demo ``` ] .debug[[k8s/operators.md](https://github.com/BretFisher/kubernetes-mastery/tree/mastery/slides/k8s/operators.md)] --- class: extra-details ## Can we use a different namespace? Yes, but then we need to update all the YAML manifests that we are going to apply in the next slides. The `eck-demo` namespace is hard-coded in these YAML manifests. Why? Because when defining a ClusterRoleBinding that references a ServiceAccount, we have to indicate in which namespace the ServiceAccount is located. .debug[[k8s/operators.md](https://github.com/BretFisher/kubernetes-mastery/tree/mastery/slides/k8s/operators.md)] --- ## Create an ElasticSearch resource - We can now create a resource with `kind: ElasticSearch` - The YAML for that resource will specify all the desired parameters: - how many nodes we want - image to use - add-ons (kibana, cerebro, ...) - whether to use TLS or not - etc. .exercise[ - Create our ElasticSearch cluster: ```bash kubectl apply -f ~/container.training/k8s/eck-elasticsearch.yaml ``` ] .debug[[k8s/operators.md](https://github.com/BretFisher/kubernetes-mastery/tree/mastery/slides/k8s/operators.md)] --- ## Operator in action - Over the next minutes, the operator will create our ES cluster - It will report our cluster status through the CRD .exercise[ - Check the logs of the operator: ```bash stern --namespace=elastic-system operator ``` <!-- ```wait elastic-operator-0``` ```tmux split-pane -v``` ---> - Watch the status of the cluster through the CRD: ```bash kubectl get es -w ``` <!-- ```longwait green``` ```key ^C``` ```key ^D``` ```key ^C``` --> ] .debug[[k8s/operators.md](https://github.com/BretFisher/kubernetes-mastery/tree/mastery/slides/k8s/operators.md)] --- ## Connecting to our cluster - It's not easy to use the ElasticSearch API from the shell - But let's check at least if ElasticSearch is up! .exercise[ - Get the ClusterIP of our ES instance: ```bash kubectl get services ``` - Issue a request with `curl`: ```bash curl http://`CLUSTERIP`:9200 ``` ] We get an authentication error. Our cluster is protected! .debug[[k8s/operators.md](https://github.com/BretFisher/kubernetes-mastery/tree/mastery/slides/k8s/operators.md)] --- ## Obtaining the credentials - The operator creates a user named `elastic` - It generates a random password and stores it in a Secret .exercise[ - Extract the password: ```bash kubectl get secret demo-es-elastic-user \ -o go-template="{{ .data.elastic | base64decode }} " ``` - Use it to connect to the API: ```bash curl -u elastic:`PASSWORD` http://`CLUSTERIP`:9200 ``` ] We should see a JSON payload with the `"You Know, for Search"` tagline. .debug[[k8s/operators.md](https://github.com/BretFisher/kubernetes-mastery/tree/mastery/slides/k8s/operators.md)] --- ## Sending data to the cluster - Let's send some data to our brand new ElasticSearch cluster! - We'll deploy a filebeat DaemonSet to collect node logs .exercise[ - Deploy filebeat: ```bash kubectl apply -f ~/container.training/k8s/eck-filebeat.yaml ``` - Wait until some pods are up: ```bash watch kubectl get pods -l k8s-app=filebeat ``` <!-- ```wait Running``` ```key ^C``` --> - Check that a filebeat index was created: ```bash curl -u elastic:`PASSWORD` http://`CLUSTERIP`:9200/_cat/indices ``` ] .debug[[k8s/operators.md](https://github.com/BretFisher/kubernetes-mastery/tree/mastery/slides/k8s/operators.md)] --- ## Deploying an instance of Kibana - Kibana can visualize the logs injected by filebeat - The ECK operator can also manage Kibana - Let's give it a try! .exercise[ - Deploy a Kibana instance: ```bash kubectl apply -f ~/container.training/k8s/eck-kibana.yaml ``` - Wait for it to be ready: ```bash kubectl get kibana -w ``` <!-- ```longwait green``` ```key ^C``` --> ] .debug[[k8s/operators.md](https://github.com/BretFisher/kubernetes-mastery/tree/mastery/slides/k8s/operators.md)] --- ## Connecting to Kibana - Kibana is automatically set up to conect to ElasticSearch (this is arranged by the YAML that we're using) - However, it will ask for authentication - It's using the same user/password as ElasticSearch .exercise[ - Get the NodePort allocated to Kibana: ```bash kubectl get services ``` - Connect to it with a web browser - Use the same user/password as before ] .debug[[k8s/operators.md](https://github.com/BretFisher/kubernetes-mastery/tree/mastery/slides/k8s/operators.md)] --- ## Setting up Kibana After the Kibana UI loads, we need to click around a bit .exercise[ - Pick "explore on my own" - Click on Use Elasticsearch data / Connect to your Elasticsearch index" - Enter `filebeat-*` for the index pattern and click "Next step" - Select `@timestamp` as time filter field name - Click on "discover" (the small icon looking like a compass on the left bar) - Play around! ] .debug[[k8s/operators.md](https://github.com/BretFisher/kubernetes-mastery/tree/mastery/slides/k8s/operators.md)] --- ## Scaling up the cluster - At this point, we have only one node - We are going to scale up - But first, we'll deploy Cerebro, an UI for ElasticSearch - This will let us see the state of the cluster, how indexes are sharded, etc. .debug[[k8s/operators.md](https://github.com/BretFisher/kubernetes-mastery/tree/mastery/slides/k8s/operators.md)] --- ## Deploying Cerebro - Cerebro is stateless, so it's fairly easy to deploy (one Deployment + one Service) - However, it needs the address and credentials for ElasticSearch - We prepared yet another manifest for that! .exercise[ - Deploy Cerebro: ```bash kubectl apply -f ~/container.training/k8s/eck-cerebro.yaml ``` - Lookup the NodePort number and connect to it: ```bash kubectl get services ``` ] .debug[[k8s/operators.md](https://github.com/BretFisher/kubernetes-mastery/tree/mastery/slides/k8s/operators.md)] --- ## Scaling up the cluster - We can see on Cerebro that the cluster is "yellow" (because our index is not replicated) - Let's change that! .exercise[ - Edit the ElasticSearch cluster manifest: ```bash kubectl edit es demo ``` - Find the field `count: 1` and change it to 3 - Save and quit <!-- ```wait Please edit``` ```keys /count:``` ```key ^J``` ```keys $r3:x``` ```key ^J``` --> ] .debug[[k8s/operators.md](https://github.com/BretFisher/kubernetes-mastery/tree/mastery/slides/k8s/operators.md)] --- ## Deploying our apps with operators - It is very simple to deploy with `kubectl run` / `kubectl expose` - We can unlock more features by writing YAML and using `kubectl apply` - Kustomize or Helm let us deploy in multiple environments (and adjust/tweak parameters in each environment) - We can also use an operator to deploy our application .debug[[k8s/operators.md](https://github.com/BretFisher/kubernetes-mastery/tree/mastery/slides/k8s/operators.md)] --- ## Pros and cons of deploying with operators - The app definition and configuration is persisted in the Kubernetes API - Multiple instances of the app can be manipulated with `kubectl get` - We can add labels, annotations to the app instances - Our controller can execute custom code for any lifecycle event - However, we need to write this controller - We need to be careful about changes (what happens when the resource `spec` is updated?) .debug[[k8s/operators.md](https://github.com/BretFisher/kubernetes-mastery/tree/mastery/slides/k8s/operators.md)] --- ## Operators are not magic - Look at the ElasticSearch resource definition (`~/container.training/k8s/eck-elasticsearch.yaml`) - What should happen if we flip the TLS flag? Twice? - What should happen if we add another group of nodes? - What if we want different images or parameters for the different nodes? *Operators can be very powerful. <br/> But we need to know exactly the scenarios that they can handle.* .debug[[k8s/operators.md](https://github.com/BretFisher/kubernetes-mastery/tree/mastery/slides/k8s/operators.md)] --- ## What does it take to write an operator? - Writing a quick-and-dirty operator, or a POC/MVP, is easy - Writing a robust operator is hard - We will describe the general idea - We will identify some of the associated challenges - We will list a few tools that can help us .debug[[k8s/operators-design.md](https://github.com/BretFisher/kubernetes-mastery/tree/mastery/slides/k8s/operators-design.md)] --- ## Top-down vs. bottom-up - Both approaches are possible - Let's see what they entail, and their respective pros and cons .debug[[k8s/operators-design.md](https://github.com/BretFisher/kubernetes-mastery/tree/mastery/slides/k8s/operators-design.md)] --- ## Top-down approach - Start with high-level design (see next slide) - Pros: - can yield cleaner design that will be more robust - Cons: - must be able to anticipate all the events that might happen - design will be better only to the extent of what we anticipated - hard to anticipate if we don't have production experience .debug[[k8s/operators-design.md](https://github.com/BretFisher/kubernetes-mastery/tree/mastery/slides/k8s/operators-design.md)] --- ## High-level design - What are we solving? (e.g.: geographic databases backed by PostGIS with Redis caches) - What are our use-cases, stories? (e.g.: adding/resizing caches and read replicas; load balancing queries) - What kind of outage do we want to address? (e.g.: loss of individual node, pod, volume) - What are our *non-features*, the things we don't want to address? (e.g.: loss of datacenter/zone; differentiating between read and write queries; <br/> cache invalidation; upgrading to newer major versions of Redis, PostGIS, PostgreSQL) .debug[[k8s/operators-design.md](https://github.com/BretFisher/kubernetes-mastery/tree/mastery/slides/k8s/operators-design.md)] --- ## Low-level design - What Custom Resource Definitions do we need? (one, many?) - How will we store configuration information? (part of the CRD spec fields, annotations, other?) - Do we need to store state? If so, where? - state that is small and doesn't change much can be stored via the Kubernetes API <br/> (e.g.: leader information, configuration, credentials) - things that are big and/or change a lot should go elsewhere <br/> (e.g.: metrics, bigger configuration file like GeoIP) .debug[[k8s/operators-design.md](https://github.com/BretFisher/kubernetes-mastery/tree/mastery/slides/k8s/operators-design.md)] --- class: extra-details ## What can we store via the Kubernetes API? - The API server stores most Kubernetes resources in etcd - Etcd is designed for reliability, not for performance - If our storage needs exceed what etcd can offer, we need to use something else: - either directly - or by extending the API server <br/>(for instance by using the agregation layer, like [metrics server](https://github.com/kubernetes-incubator/metrics-server) does) .debug[[k8s/operators-design.md](https://github.com/BretFisher/kubernetes-mastery/tree/mastery/slides/k8s/operators-design.md)] --- ## Bottom-up approach - Start with existing Kubernetes resources (Deployment, Stateful Set...) - Run the system in production - Add scripts, automation, to facilitate day-to-day operations - Turn the scripts into an operator - Pros: simpler to get started; reflects actual use-cases - Cons: can result in convoluted designs requiring extensive refactor .debug[[k8s/operators-design.md](https://github.com/BretFisher/kubernetes-mastery/tree/mastery/slides/k8s/operators-design.md)] --- ## General idea - Our operator will watch its CRDs *and associated resources* - Drawing state diagrams and finite state automata helps a lot - It's OK if some transitions lead to a big catch-all "human intervention" - Over time, we will learn about new failure modes and add to these diagrams - It's OK to start with CRD creation / deletion and prevent any modification (that's the easy POC/MVP we were talking about) - *Presentation* and *validation* will help our users (more on that later) .debug[[k8s/operators-design.md](https://github.com/BretFisher/kubernetes-mastery/tree/mastery/slides/k8s/operators-design.md)] --- ## Challenges - Reacting to infrastructure disruption can seem hard at first - Kubernetes gives us a lot of primitives to help: - Pods and Persistent Volumes will *eventually* recover - Stateful Sets give us easy ways to "add N copies" of a thing - The real challenges come with configuration changes (i.e., what to do when our users update our CRDs) - Keep in mind that [some] of the [largest] cloud [outages] haven't been caused by [natural catastrophes], or even code bugs, but by configuration changes [some]: https://www.datacenterdynamics.com/news/gcp-outage-mainone-leaked-google-cloudflare-ip-addresses-china-telecom/ [largest]: https://aws.amazon.com/message/41926/ [outages]: https://aws.amazon.com/message/65648/ [natural catastrophes]: https://www.datacenterknowledge.com/amazon/aws-says-it-s-never-seen-whole-data-center-go-down .debug[[k8s/operators-design.md](https://github.com/BretFisher/kubernetes-mastery/tree/mastery/slides/k8s/operators-design.md)] --- ## Configuration changes - It is helpful to analyze and understand how Kubernetes controllers work: - watch resource for modifications - compare desired state (CRD) and current state - issue actions to converge state - Configuration changes will probably require *another* state diagram or FSA - Again, it's OK to have transitions labeled as "unsupported" (i.e. reject some modifications because we can't execute them) .debug[[k8s/operators-design.md](https://github.com/BretFisher/kubernetes-mastery/tree/mastery/slides/k8s/operators-design.md)] --- ## Tools - CoreOS / RedHat Operator Framework [GitHub](https://github.com/operator-framework) | [Blog](https://developers.redhat.com/blog/2018/12/18/introduction-to-the-kubernetes-operator-framework/) | [Intro talk](https://www.youtube.com/watch?v=8k_ayO1VRXE) | [Deep dive talk](https://www.youtube.com/watch?v=fu7ecA2rXmc) | [Simple example](https://medium.com/faun/writing-your-first-kubernetes-operator-8f3df4453234) - Zalando Kubernetes Operator Pythonic Framework (KOPF) [GitHub](https://github.com/zalando-incubator/kopf) | [Docs](https://kopf.readthedocs.io/) | [Step-by-step tutorial](https://kopf.readthedocs.io/en/stable/walkthrough/problem/) - Mesosphere Kubernetes Universal Declarative Operator (KUDO) [GitHub](https://github.com/kudobuilder/kudo) | [Blog](https://mesosphere.com/blog/announcing-maestro-a-declarative-no-code-approach-to-kubernetes-day-2-operators/) | [Docs](https://kudo.dev/) | [Zookeeper example](https://github.com/kudobuilder/frameworks/tree/master/repo/stable/zookeeper) .debug[[k8s/operators-design.md](https://github.com/BretFisher/kubernetes-mastery/tree/mastery/slides/k8s/operators-design.md)] --- ## Validation - By default, a CRD is "free form" (we can put pretty much anything we want in it) - When creating a CRD, we can provide an OpenAPI v3 schema ([Example](https://github.com/amaizfinance/redis-operator/blob/master/deploy/crds/k8s_v1alpha1_redis_crd.yaml#L34)) - The API server will then validate resources created/edited with this schema - If we need a stronger validation, we can use a Validating Admission Webhook: - run an [admission webhook server](https://kubernetes.io/docs/reference/access-authn-authz/extensible-admission-controllers/#write-an-admission-webhook-server) to receive validation requests - register the webhook by creating a [ValidatingWebhookConfiguration](https://kubernetes.io/docs/reference/access-authn-authz/extensible-admission-controllers/#configure-admission-webhooks-on-the-fly) - each time the API server receives a request matching the configuration, <br/>the request is sent to our server for validation .debug[[k8s/operators-design.md](https://github.com/BretFisher/kubernetes-mastery/tree/mastery/slides/k8s/operators-design.md)] --- ## Presentation - By default, `kubectl get mycustomresource` won't display much information (just the name and age of each resource) - When creating a CRD, we can specify additional columns to print ([Example](https://github.com/amaizfinance/redis-operator/blob/master/deploy/crds/k8s_v1alpha1_redis_crd.yaml#L6), [Docs](https://kubernetes.io/docs/tasks/access-kubernetes-api/custom-resources/custom-resource-definitions/#additional-printer-columns)) - By default, `kubectl describe mycustomresource` will also be generic - `kubectl describe` can show events related to our custom resources (for that, we need to create Event resources, and fill the `involvedObject` field) - For scalable resources, we can define a `scale` sub-resource - This will enable the use of `kubectl scale` and other scaling-related operations .debug[[k8s/operators-design.md](https://github.com/BretFisher/kubernetes-mastery/tree/mastery/slides/k8s/operators-design.md)] --- ## About scaling - It is possible to use the HPA (Horizontal Pod Autoscaler) with CRDs - But it is not always desirable - The HPA works very well for homogenous, stateless workloads - For other workloads, your mileage may vary - Some systems can scale across multiple dimensions (for instance: increase number of replicas, or number of shards?) - If autoscaling is desired, the operator will have to take complex decisions (example: Zalando's Elasticsearch Operator ([Video](https://www.youtube.com/watch?v=lprE0J0kAq0))) .debug[[k8s/operators-design.md](https://github.com/BretFisher/kubernetes-mastery/tree/mastery/slides/k8s/operators-design.md)] --- ## Versioning - As our operator evolves over time, we may have to change the CRD (add, remove, change fields) - Like every other resource in Kubernetes, [custom resources are versioned](https://kubernetes.io/docs/tasks/access-kubernetes-api/custom-resources/custom-resource-definition-versioning/ ) - When creating a CRD, we need to specify a *list* of versions - Versions can be marked as `stored` and/or `served` .debug[[k8s/operators-design.md](https://github.com/BretFisher/kubernetes-mastery/tree/mastery/slides/k8s/operators-design.md)] --- ## Stored version - Exactly one version has to be marked as the `stored` version - As the name implies, it is the one that will be stored in etcd - Resources in storage are never converted automatically (we need to read and re-write them ourselves) - Yes, this means that we can have different versions in etcd at any time - Our code needs to handle all the versions that still exist in storage .debug[[k8s/operators-design.md](https://github.com/BretFisher/kubernetes-mastery/tree/mastery/slides/k8s/operators-design.md)] --- ## Served versions - By default, the Kubernetes API will serve resources "as-is" (using their stored version) - It will assume that all versions are compatible storage-wise (i.e. that the spec and fields are compatible between versions) - We can provide [conversion webhooks](https://kubernetes.io/docs/tasks/access-kubernetes-api/custom-resources/custom-resource-definition-versioning/#webhook-conversion) to "translate" requests (the alternative is to upgrade all stored resources and stop serving old versions) .debug[[k8s/operators-design.md](https://github.com/BretFisher/kubernetes-mastery/tree/mastery/slides/k8s/operators-design.md)] --- ## Operator reliability - Remember that the operator itself must be resilient (e.g.: the node running it can fail) - Our operator must be able to restart and recover gracefully - Do not store state locally (unless we can reconstruct that state when we restart) - As indicated earlier, we can use the Kubernetes API to store data: - in the custom resources themselves - in other resources' annotations .debug[[k8s/operators-design.md](https://github.com/BretFisher/kubernetes-mastery/tree/mastery/slides/k8s/operators-design.md)] --- ## Beyond CRDs - CRDs cannot use custom storage (e.g. for time series data) - CRDs cannot support arbitrary subresources (like logs or exec for Pods) - CRDs cannot support protobuf (for faster, more efficient communication) - If we need these things, we can use the [aggregation layer](https://kubernetes.io/docs/concepts/extend-kubernetes/api-extension/apiserver-aggregation/) instead - The aggregation layer proxies all requests below a specific path to another server (this is used e.g. by the metrics server) - [This documentation page](https://kubernetes.io/docs/concepts/extend-kubernetes/api-extension/custom-resources/#choosing-a-method-for-adding-custom-resources) compares the features of CRDs and API aggregation .debug[[k8s/operators-design.md](https://github.com/BretFisher/kubernetes-mastery/tree/mastery/slides/k8s/operators-design.md)] --- class: pic .interstitial[] --- name: toc-owners-and-dependents class: title Owners and dependents .nav[ [Previous section](#toc-operators) | [Back to table of contents](#toc-chapter-12) | [Next section](#toc-building-our-own-cluster) ] .debug[(automatically generated title slide)] --- # Owners and dependents - Some objects are created by other objects (example: pods created by replica sets, themselves created by deployments) - When an *owner* object is deleted, its *dependents* are deleted (this is the default behavior; it can be changed) - We can delete a dependent directly if we want (but generally, the owner will recreate another right away) - An object can have multiple owners .debug[[k8s/owners-and-dependents.md](https://github.com/BretFisher/kubernetes-mastery/tree/mastery/slides/k8s/owners-and-dependents.md)] --- ## Finding out the owners of an object - The owners are recorded in the field `ownerReferences` in the `metadata` block .exercise[ - Let's create a deployment running `nginx`: ```bash kubectl create deployment yanginx --image=nginx ``` - Scale it to a few replicas: ```bash kubectl scale deployment yanginx --replicas=3 ``` - Once it's up, check the corresponding pods: ```bash kubectl get pods -l app=yanginx -o yaml | head -n 25 ``` ] These pods are owned by a ReplicaSet named yanginx-xxxxxxxxxx. .debug[[k8s/owners-and-dependents.md](https://github.com/BretFisher/kubernetes-mastery/tree/mastery/slides/k8s/owners-and-dependents.md)] --- ## Listing objects with their owners - This is a good opportunity to try the `custom-columns` output! .exercise[ - Show all pods with their owners: ```bash kubectl get pod -o custom-columns=\ NAME:.metadata.name,\ OWNER-KIND:.metadata.ownerReferences[0].kind,\ OWNER-NAME:.metadata.ownerReferences[0].name ``` ] Note: the `custom-columns` option should be one long option (without spaces), so the lines should not be indented (otherwise the indentation will insert spaces). .debug[[k8s/owners-and-dependents.md](https://github.com/BretFisher/kubernetes-mastery/tree/mastery/slides/k8s/owners-and-dependents.md)] --- ## Deletion policy - When deleting an object through the API, three policies are available: - foreground (API call returns after all dependents are deleted) - background (API call returns immediately; dependents are scheduled for deletion) - orphan (the dependents are not deleted) - When deleting an object with `kubectl`, this is selected with `--cascade`: - `--cascade=true` deletes all dependent objects (default) - `--cascade=false` orphans dependent objects .debug[[k8s/owners-and-dependents.md](https://github.com/BretFisher/kubernetes-mastery/tree/mastery/slides/k8s/owners-and-dependents.md)] --- ## What happens when an object is deleted - It is removed from the list of owners of its dependents - If, for one of these dependents, the list of owners becomes empty ... - if the policy is "orphan", the object stays - otherwise, the object is deleted .debug[[k8s/owners-and-dependents.md](https://github.com/BretFisher/kubernetes-mastery/tree/mastery/slides/k8s/owners-and-dependents.md)] --- ## Orphaning pods - We are going to delete the Deployment and Replica Set that we created - ... without deleting the corresponding pods! .exercise[ - Delete the Deployment: ```bash kubectl delete deployment -l app=yanginx --cascade=false ``` - Delete the Replica Set: ```bash kubectl delete replicaset -l app=yanginx --cascade=false ``` - Check that the pods are still here: ```bash kubectl get pods ``` ] .debug[[k8s/owners-and-dependents.md](https://github.com/BretFisher/kubernetes-mastery/tree/mastery/slides/k8s/owners-and-dependents.md)] --- class: extra-details ## When and why would we have orphans? - If we remove an owner and explicitly instruct the API to orphan dependents (like on the previous slide) - If we change the labels on a dependent, so that it's not selected anymore (e.g. change the `app: yanginx` in the pods of the previous example) - If a deployment tool that we're using does these things for us - If there is a serious problem within API machinery or other components (i.e. "this should not happen") .debug[[k8s/owners-and-dependents.md](https://github.com/BretFisher/kubernetes-mastery/tree/mastery/slides/k8s/owners-and-dependents.md)] --- ## Finding orphan objects - We're going to output all pods in JSON format - Then we will use `jq` to keep only the ones *without* an owner - And we will display their name .exercise[ - List all pods that *do not* have an owner: ```bash kubectl get pod -o json | jq -r " .items[] | select(.metadata.ownerReferences|not) | .metadata.name" ``` ] .debug[[k8s/owners-and-dependents.md](https://github.com/BretFisher/kubernetes-mastery/tree/mastery/slides/k8s/owners-and-dependents.md)] --- ## Deleting orphan pods - Now that we can list orphan pods, deleting them is easy .exercise[ - Add `| xargs kubectl delete pod` to the previous command: ```bash kubectl get pod -o json | jq -r " .items[] | select(.metadata.ownerReferences|not) | .metadata.name" | xargs kubectl delete pod ``` ] As always, the [documentation](https://kubernetes.io/docs/concepts/workloads/controllers/garbage-collection/) has useful extra information and pointers. .debug[[k8s/owners-and-dependents.md](https://github.com/BretFisher/kubernetes-mastery/tree/mastery/slides/k8s/owners-and-dependents.md)] --- class: pic .interstitial[] --- name: toc-building-our-own-cluster class: title Building our own cluster .nav[ [Previous section](#toc-owners-and-dependents) | [Back to table of contents](#toc-chapter-13) | [Next section](#toc-adding-nodes-to-the-cluster) ] .debug[(automatically generated title slide)] --- # Building our own cluster - Let's build our own cluster! *Perfection is attained not when there is nothing left to add, but when there is nothing left to take away. (Antoine de Saint-Exupery)* - Our goal is to build a minimal cluster allowing us to: - create a Deployment (with `kubectl run` or `kubectl create deployment`) - expose it with a Service - connect to that service - "Minimal" here means: - smaller number of components - smaller number of command-line flags - smaller number of configuration files .debug[[k8s/dmuc.md](https://github.com/BretFisher/kubernetes-mastery/tree/mastery/slides/k8s/dmuc.md)] --- ## Non-goals - For now, we don't care about security - For now, we don't care about scalability - For now, we don't care about high availability - All we care about is *simplicity* .debug[[k8s/dmuc.md](https://github.com/BretFisher/kubernetes-mastery/tree/mastery/slides/k8s/dmuc.md)] --- ## Our environment - We will use the machine indicated as `dmuc1` (this stands for "Dessine Moi Un Cluster" or "Draw Me A Sheep", <br/>in homage to Saint-Exupery's "The Little Prince") - This machine: - runs Ubuntu LTS - has Kubernetes, Docker, and etcd binaries installed - but nothing is running .debug[[k8s/dmuc.md](https://github.com/BretFisher/kubernetes-mastery/tree/mastery/slides/k8s/dmuc.md)] --- ## Checking our environment - Let's make sure we have everything we need first .exercise[ - Log into the `dmuc1` machine - Get root: ```bash sudo -i ``` - Check available versions: ```bash etcd -version kube-apiserver --version dockerd --version ``` ] .debug[[k8s/dmuc.md](https://github.com/BretFisher/kubernetes-mastery/tree/mastery/slides/k8s/dmuc.md)] --- ## The plan 1. Start API server 2. Interact with it (create Deployment and Service) 3. See what's broken 4. Fix it and go back to step 2 until it works! .debug[[k8s/dmuc.md](https://github.com/BretFisher/kubernetes-mastery/tree/mastery/slides/k8s/dmuc.md)] --- ## Dealing with multiple processes - We are going to start many processes - Depending on what you're comfortable with, you can: - open multiple windows and multiple SSH connections - use a terminal multiplexer like screen or tmux - put processes in the background with `&` <br/>(warning: log output might get confusing to read!) .debug[[k8s/dmuc.md](https://github.com/BretFisher/kubernetes-mastery/tree/mastery/slides/k8s/dmuc.md)] --- ## Starting API server .exercise[ - Try to start the API server: ```bash kube-apiserver # It will fail with "--etcd-servers must be specified" ``` ] Since the API server stores everything in etcd, it cannot start without it. .debug[[k8s/dmuc.md](https://github.com/BretFisher/kubernetes-mastery/tree/mastery/slides/k8s/dmuc.md)] --- ## Starting etcd .exercise[ - Try to start etcd: ```bash etcd ``` ] Success! Note the last line of output: ``` serving insecure client requests on 127.0.0.1:2379, this is strongly discouraged! ``` *Sure, that's discouraged. But thanks for telling us the address!* .debug[[k8s/dmuc.md](https://github.com/BretFisher/kubernetes-mastery/tree/mastery/slides/k8s/dmuc.md)] --- ## Starting API server (for real) - Try again, passing the `--etcd-servers` argument - That argument should be a comma-separated list of URLs .exercise[ - Start API server: ```bash kube-apiserver --etcd-servers http://127.0.0.1:2379 ``` ] Success! .debug[[k8s/dmuc.md](https://github.com/BretFisher/kubernetes-mastery/tree/mastery/slides/k8s/dmuc.md)] --- ## Interacting with API server - Let's try a few "classic" commands .exercise[ - List nodes: ```bash kubectl get nodes ``` - List services: ```bash kubectl get services ``` ] We should get `No resources found.` and the `kubernetes` service, respectively. Note: the API server automatically created the `kubernetes` service entry. .debug[[k8s/dmuc.md](https://github.com/BretFisher/kubernetes-mastery/tree/mastery/slides/k8s/dmuc.md)] --- class: extra-details ## What about `kubeconfig`? - We didn't need to create a `kubeconfig` file - By default, the API server is listening on `localhost:8080` (without requiring authentication) - By default, `kubectl` connects to `localhost:8080` (without providing authentication) .debug[[k8s/dmuc.md](https://github.com/BretFisher/kubernetes-mastery/tree/mastery/slides/k8s/dmuc.md)] --- ## Creating a Deployment - Let's run a web server! .exercise[ - Create a Deployment with NGINX: ```bash kubectl create deployment web --image=nginx ``` ] Success? .debug[[k8s/dmuc.md](https://github.com/BretFisher/kubernetes-mastery/tree/mastery/slides/k8s/dmuc.md)] --- ## Checking our Deployment status .exercise[ - Look at pods, deployments, etc.: ```bash kubectl get all ``` ] Our Deployment is in bad shape: ``` NAME READY UP-TO-DATE AVAILABLE AGE deployment.apps/web 0/1 0 0 2m26s ``` And, there is no ReplicaSet, and no Pod. .debug[[k8s/dmuc.md](https://github.com/BretFisher/kubernetes-mastery/tree/mastery/slides/k8s/dmuc.md)] --- ## What's going on? - We stored the definition of our Deployment in etcd (through the API server) - But there is no *controller* to do the rest of the work - We need to start the *controller manager* .debug[[k8s/dmuc.md](https://github.com/BretFisher/kubernetes-mastery/tree/mastery/slides/k8s/dmuc.md)] --- ## Starting the controller manager .exercise[ - Try to start the controller manager: ```bash kube-controller-manager ``` ] The final error message is: ``` invalid configuration: no configuration has been provided ``` But the logs include another useful piece of information: ``` Neither --kubeconfig nor --master was specified. Using the inClusterConfig. This might not work. ``` .debug[[k8s/dmuc.md](https://github.com/BretFisher/kubernetes-mastery/tree/mastery/slides/k8s/dmuc.md)] --- ## Reminder: everyone talks to API server - The controller manager needs to connect to the API server - It *does not* have a convenient `localhost:8080` default - We can pass the connection information in two ways: - `--master` and a host:port combination (easy) - `--kubeconfig` and a `kubeconfig` file - For simplicity, we'll use the first option .debug[[k8s/dmuc.md](https://github.com/BretFisher/kubernetes-mastery/tree/mastery/slides/k8s/dmuc.md)] --- ## Starting the controller manager (for real) .exercise[ - Start the controller manager: ```bash kube-controller-manager --master http://localhost:8080 ``` ] Success! .debug[[k8s/dmuc.md](https://github.com/BretFisher/kubernetes-mastery/tree/mastery/slides/k8s/dmuc.md)] --- ## Checking our Deployment status .exercise[ - Check all our resources again: ```bash kubectl get all ``` ] We now have a ReplicaSet. But we still don't have a Pod. .debug[[k8s/dmuc.md](https://github.com/BretFisher/kubernetes-mastery/tree/mastery/slides/k8s/dmuc.md)] --- ## What's going on? In the controller manager logs, we should see something like this: ``` E0404 15:46:25.753376 22847 replica_set.go:450] Sync "default/web-5bc9bd5b8d" failed with `No API token found for service account "default"`, retry after the token is automatically created and added to the service account ``` - The service account `default` was automatically added to our Deployment (and to its pods) - The service account `default` exists - But it doesn't have an associated token (the token is a secret; creating it requires signature; therefore a CA) .debug[[k8s/dmuc.md](https://github.com/BretFisher/kubernetes-mastery/tree/mastery/slides/k8s/dmuc.md)] --- ## Solving the missing token issue There are many ways to solve that issue. We are going to list a few (to get an idea of what's happening behind the scenes). Of course, we don't need to perform *all* the solutions mentioned here. .debug[[k8s/dmuc.md](https://github.com/BretFisher/kubernetes-mastery/tree/mastery/slides/k8s/dmuc.md)] --- ## Option 1: disable service accounts - Restart the API server with `--disable-admission-plugins=ServiceAccount` - The API server will no longer add a service account automatically - Our pods will be created without a service account .debug[[k8s/dmuc.md](https://github.com/BretFisher/kubernetes-mastery/tree/mastery/slides/k8s/dmuc.md)] --- ## Option 2: do not mount the (missing) token - Add `automountServiceAccountToken: false` to the Deployment spec *or* - Add `automountServiceAccountToken: false` to the default ServiceAccount - The ReplicaSet controller will no longer create pods referencing the (missing) token .exercise[ - Programmatically change the `default` ServiceAccount: ```bash kubectl patch sa default -p "automountServiceAccountToken: false" ``` ] .debug[[k8s/dmuc.md](https://github.com/BretFisher/kubernetes-mastery/tree/mastery/slides/k8s/dmuc.md)] --- ## Option 3: set up service accounts properly - This is the most complex option! - Generate a key pair - Pass the private key to the controller manager (to generate and sign tokens) - Pass the public key to the API server (to verify these tokens) .debug[[k8s/dmuc.md](https://github.com/BretFisher/kubernetes-mastery/tree/mastery/slides/k8s/dmuc.md)] --- ## Continuing without service account token - Once we patch the default service account, the ReplicaSet can create a Pod .exercise[ - Check that we now have a pod: ```bash kubectl get all ``` ] Note: we might have to wait a bit for the ReplicaSet controller to retry. If we're impatient, we can restart the controller manager. .debug[[k8s/dmuc.md](https://github.com/BretFisher/kubernetes-mastery/tree/mastery/slides/k8s/dmuc.md)] --- ## What's next? - Our pod exists, but it is in `Pending` state - Remember, we don't have a node so far (`kubectl get nodes` shows an empty list) - We need to: - start a container engine - start kubelet .debug[[k8s/dmuc.md](https://github.com/BretFisher/kubernetes-mastery/tree/mastery/slides/k8s/dmuc.md)] --- ## Starting a container engine - We're going to use Docker (because it's the default option) .exercise[ - Start the Docker Engine: ```bash dockerd ``` ] Success! Feel free to check that it actually works with e.g.: ```bash docker run alpine echo hello world ``` .debug[[k8s/dmuc.md](https://github.com/BretFisher/kubernetes-mastery/tree/mastery/slides/k8s/dmuc.md)] --- ## Starting kubelet - If we start kubelet without arguments, it *will* start - But it will not join the cluster! - It will start in *standalone* mode - Just like with the controller manager, we need to tell kubelet where the API server is - Alas, kubelet doesn't have a simple `--master` option - We have to use `--kubeconfig` - We need to write a `kubeconfig` file for kubelet .debug[[k8s/dmuc.md](https://github.com/BretFisher/kubernetes-mastery/tree/mastery/slides/k8s/dmuc.md)] --- ## Writing a kubeconfig file - We can copy/paste a bunch of YAML - Or we can generate the file with `kubectl` .exercise[ - Create the file `~/.kube/config` with `kubectl`: ```bash kubectl config \ set-cluster localhost --server http://localhost:8080 kubectl config \ set-context localhost --cluster localhost kubectl config \ use-context localhost ``` ] .debug[[k8s/dmuc.md](https://github.com/BretFisher/kubernetes-mastery/tree/mastery/slides/k8s/dmuc.md)] --- ## Our `~/.kube/config` file The file that we generated looks like the one below. That one has been slightly simplified (removing extraneous fields), but it is still valid. ```yaml apiVersion: v1 kind: Config current-context: localhost contexts: - name: localhost context: cluster: localhost clusters: - name: localhost cluster: server: http://localhost:8080 ``` .debug[[k8s/dmuc.md](https://github.com/BretFisher/kubernetes-mastery/tree/mastery/slides/k8s/dmuc.md)] --- ## Starting kubelet .exercise[ - Start kubelet with that kubeconfig file: ```bash kubelet --kubeconfig ~/.kube/config ``` ] Success! .debug[[k8s/dmuc.md](https://github.com/BretFisher/kubernetes-mastery/tree/mastery/slides/k8s/dmuc.md)] --- ## Looking at our 1-node cluster - Let's check that our node registered correctly .exercise[ - List the nodes in our cluster: ```bash kubectl get nodes ``` ] Our node should show up. Its name will be its hostname (it should be `dmuc1`). .debug[[k8s/dmuc.md](https://github.com/BretFisher/kubernetes-mastery/tree/mastery/slides/k8s/dmuc.md)] --- ## Are we there yet? - Let's check if our pod is running .exercise[ - List all resources: ```bash kubectl get all ``` ] -- Our pod is still `Pending`. 🤔 -- Which is normal: it needs to be *scheduled*. (i.e., something needs to decide which node it should go on.) .debug[[k8s/dmuc.md](https://github.com/BretFisher/kubernetes-mastery/tree/mastery/slides/k8s/dmuc.md)] --- ## Scheduling our pod - Why do we need a scheduling decision, since we have only one node? - The node might be full, unavailable; the pod might have constraints ... - The easiest way to schedule our pod is to start the scheduler (we could also schedule it manually) .debug[[k8s/dmuc.md](https://github.com/BretFisher/kubernetes-mastery/tree/mastery/slides/k8s/dmuc.md)] --- ## Starting the scheduler - The scheduler also needs to know how to connect to the API server - Just like for controller manager, we can use `--kubeconfig` or `--master` .exercise[ - Start the scheduler: ```bash kube-scheduler --master http://localhost:8080 ``` ] - Our pod should now start correctly .debug[[k8s/dmuc.md](https://github.com/BretFisher/kubernetes-mastery/tree/mastery/slides/k8s/dmuc.md)] --- ## Checking the status of our pod - Our pod will go through a short `ContainerCreating` phase - Then it will be `Running` .exercise[ - Check pod status: ```bash kubectl get pods ``` ] Success! .debug[[k8s/dmuc.md](https://github.com/BretFisher/kubernetes-mastery/tree/mastery/slides/k8s/dmuc.md)] --- class: extra-details ## Scheduling a pod manually - We can schedule a pod in `Pending` state by creating a Binding, e.g.: ```bash kubectl create -f- <<EOF apiVersion: v1 kind: Binding metadata: name: name-of-the-pod target: apiVersion: v1 kind: Node name: name-of-the-node EOF ``` - This is actually how the scheduler works! - It watches pods, makes scheduling decisions, and creates Binding objects .debug[[k8s/dmuc.md](https://github.com/BretFisher/kubernetes-mastery/tree/mastery/slides/k8s/dmuc.md)] --- ## Connecting to our pod - Let's check that our pod correctly runs NGINX .exercise[ - Check our pod's IP address: ```bash kubectl get pods -o wide ``` - Send some HTTP request to the pod: ```bash curl `X.X.X.X` ``` ] We should see the `Welcome to nginx!` page. .debug[[k8s/dmuc.md](https://github.com/BretFisher/kubernetes-mastery/tree/mastery/slides/k8s/dmuc.md)] --- ## Exposing our Deployment - We can now create a Service associated with this Deployment .exercise[ - Expose the Deployment's port 80: ```bash kubectl expose deployment web --port=80 ``` - Check the Service's ClusterIP, and try connecting: ```bash kubectl get service web curl http://`X.X.X.X` ``` ] -- This won't work. We need kube-proxy to enable internal communication. .debug[[k8s/dmuc.md](https://github.com/BretFisher/kubernetes-mastery/tree/mastery/slides/k8s/dmuc.md)] --- ## Starting kube-proxy - kube-proxy also needs to connect to the API server - It can work with the `--master` flag (although that will be deprecated in the future) .exercise[ - Start kube-proxy: ```bash kube-proxy --master http://localhost:8080 ``` ] .debug[[k8s/dmuc.md](https://github.com/BretFisher/kubernetes-mastery/tree/mastery/slides/k8s/dmuc.md)] --- ## Connecting to our Service - Now that kube-proxy is running, we should be able to connect .exercise[ - Check the Service's ClusterIP again, and retry connecting: ```bash kubectl get service web curl http://`X.X.X.X` ``` ] Success! .debug[[k8s/dmuc.md](https://github.com/BretFisher/kubernetes-mastery/tree/mastery/slides/k8s/dmuc.md)] --- class: extra-details ## How kube-proxy works - kube-proxy watches Service resources - When a Service is created or updated, kube-proxy creates iptables rules .exercise[ - Check out the `OUTPUT` chain in the `nat` table: ```bash iptables -t nat -L OUTPUT ``` - Traffic is sent to `KUBE-SERVICES`; check that too: ```bash iptables -t nat -L KUBE-SERVICES ``` ] For each Service, there is an entry in that chain. .debug[[k8s/dmuc.md](https://github.com/BretFisher/kubernetes-mastery/tree/mastery/slides/k8s/dmuc.md)] --- class: extra-details ## Diving into iptables - The last command showed a chain named `KUBE-SVC-...` corresponding to our service .exercise[ - Check that `KUBE-SVC-...` chain: ```bash iptables -t nat -L `KUBE-SVC-...` ``` - It should show a jump to a `KUBE-SEP-...` chains; check it out too: ```bash iptables -t nat -L `KUBE-SEP-...` ``` ] This is a `DNAT` rule to rewrite the destination address of the connection to our pod. This is how kube-proxy works! .debug[[k8s/dmuc.md](https://github.com/BretFisher/kubernetes-mastery/tree/mastery/slides/k8s/dmuc.md)] --- class: extra-details ## kube-router, IPVS - With recent versions of Kubernetes, it is possible to tell kube-proxy to use IPVS - IPVS is a more powerful load balancing framework (remember: iptables was primarily designed for firewalling, not load balancing!) - It is also possible to replace kube-proxy with kube-router - kube-router uses IPVS by default - kube-router can also perform other functions (e.g., we can use it as a CNI plugin to provide pod connectivity) .debug[[k8s/dmuc.md](https://github.com/BretFisher/kubernetes-mastery/tree/mastery/slides/k8s/dmuc.md)] --- class: extra-details ## What about the `kubernetes` service? - If we try to connect, it won't work (by default, it should be `10.0.0.1`) - If we look at the Endpoints for this service, we will see one endpoint: `host-address:6443` - By default, the API server expects to be running directly on the nodes (it could be as a bare process, or in a container/pod using the host network) - ... And it expects to be listening on port 6443 with TLS .debug[[k8s/dmuc.md](https://github.com/BretFisher/kubernetes-mastery/tree/mastery/slides/k8s/dmuc.md)] --- class: pic .interstitial[] --- name: toc-adding-nodes-to-the-cluster class: title Adding nodes to the cluster .nav[ [Previous section](#toc-building-our-own-cluster) | [Back to table of contents](#toc-chapter-13) | [Next section](#toc-the-container-network-interface) ] .debug[(automatically generated title slide)] --- # Adding nodes to the cluster - So far, our cluster has only 1 node - Let's see what it takes to add more nodes - We are going to use another set of machines: `kubenet` .debug[[k8s/multinode.md](https://github.com/BretFisher/kubernetes-mastery/tree/mastery/slides/k8s/multinode.md)] --- ## The environment - We have 3 identical machines: `kubenet1`, `kubenet2`, `kubenet3` - The Docker Engine is installed (and running) on these machines - The Kubernetes packages are installed, but nothing is running - We will use `kubenet1` to run the control plane .debug[[k8s/multinode.md](https://github.com/BretFisher/kubernetes-mastery/tree/mastery/slides/k8s/multinode.md)] --- ## The plan - Start the control plane on `kubenet1` - Join the 3 nodes to the cluster - Deploy and scale a simple web server .exercise[ - Log into `kubenet1` ] .debug[[k8s/multinode.md](https://github.com/BretFisher/kubernetes-mastery/tree/mastery/slides/k8s/multinode.md)] --- ## Running the control plane - We will use a Compose file to start the control plane components .exercise[ - Clone the repository containing the workshop materials: ```bash git clone https://github.com/jpetazzo/container.training ``` - Go to the `compose/simple-k8s-control-plane` directory: ```bash cd container.training/compose/simple-k8s-control-plane ``` - Start the control plane: ```bash docker-compose up ``` ] .debug[[k8s/multinode.md](https://github.com/BretFisher/kubernetes-mastery/tree/mastery/slides/k8s/multinode.md)] --- ## Checking the control plane status - Before moving on, verify that the control plane works .exercise[ - Show control plane component statuses: ```bash kubectl get componentstatuses kubectl get cs ``` - Show the (empty) list of nodes: ```bash kubectl get nodes ``` ] .debug[[k8s/multinode.md](https://github.com/BretFisher/kubernetes-mastery/tree/mastery/slides/k8s/multinode.md)] --- class: extra-details ## Differences from `dmuc` - Our new control plane listens on `0.0.0.0` instead of the default `127.0.0.1` - The ServiceAccount admission plugin is disabled .debug[[k8s/multinode.md](https://github.com/BretFisher/kubernetes-mastery/tree/mastery/slides/k8s/multinode.md)] --- ## Joining the nodes - We need to generate a `kubeconfig` file for kubelet - This time, we need to put the public IP address of `kubenet1` (instead of `localhost` or `127.0.0.1`) .exercise[ - Generate the `kubeconfig` file: ```bash kubectl config set-cluster kubenet --server http://`X.X.X.X`:8080 kubectl config set-context kubenet --cluster kubenet kubectl config use-context kubenet cp ~/.kube/config ~/kubeconfig ``` ] .debug[[k8s/multinode.md](https://github.com/BretFisher/kubernetes-mastery/tree/mastery/slides/k8s/multinode.md)] --- ## Distributing the `kubeconfig` file - We need that `kubeconfig` file on the other nodes, too .exercise[ - Copy `kubeconfig` to the other nodes: ```bash for N in 2 3; do scp ~/kubeconfig kubenet$N: done ``` ] .debug[[k8s/multinode.md](https://github.com/BretFisher/kubernetes-mastery/tree/mastery/slides/k8s/multinode.md)] --- ## Starting kubelet - Reminder: kubelet needs to run as root; don't forget `sudo`! .exercise[ - Join the first node: ```bash sudo kubelet --kubeconfig ~/kubeconfig ``` - Open more terminals and join the other nodes to the cluster: ```bash ssh kubenet2 sudo kubelet --kubeconfig ~/kubeconfig ssh kubenet3 sudo kubelet --kubeconfig ~/kubeconfig ``` ] .debug[[k8s/multinode.md](https://github.com/BretFisher/kubernetes-mastery/tree/mastery/slides/k8s/multinode.md)] --- ## Checking cluster status - We should now see all 3 nodes - At first, their `STATUS` will be `NotReady` - They will move to `Ready` state after approximately 10 seconds .exercise[ - Check the list of nodes: ```bash kubectl get nodes ``` ] .debug[[k8s/multinode.md](https://github.com/BretFisher/kubernetes-mastery/tree/mastery/slides/k8s/multinode.md)] --- ## Deploy a web server - Let's create a Deployment and scale it (so that we have multiple pods on multiple nodes) .exercise[ - Create a Deployment running NGINX: ```bash kubectl create deployment web --image=nginx ``` - Scale it: ```bash kubectl scale deployment web --replicas=5 ``` ] .debug[[k8s/multinode.md](https://github.com/BretFisher/kubernetes-mastery/tree/mastery/slides/k8s/multinode.md)] --- ## Check our pods - The pods will be scheduled on the nodes - The nodes will pull the `nginx` image, and start the pods - What are the IP addresses of our pods? .exercise[ - Check the IP addresses of our pods ```bash kubectl get pods -o wide ``` ] -- 🤔 Something's not right ... Some pods have the same IP address! .debug[[k8s/multinode.md](https://github.com/BretFisher/kubernetes-mastery/tree/mastery/slides/k8s/multinode.md)] --- ## What's going on? - Without the `--network-plugin` flag, kubelet defaults to "no-op" networking - It lets the container engine use a default network (in that case, we end up with the default Docker bridge) - Our pods are running on independent, disconnected, host-local networks .debug[[k8s/multinode.md](https://github.com/BretFisher/kubernetes-mastery/tree/mastery/slides/k8s/multinode.md)] --- ## What do we need to do? - On a normal cluster, kubelet is configured to set up pod networking with CNI plugins - This requires: - installing CNI plugins - writing CNI configuration files - running kubelet with `--network-plugin=cni` .debug[[k8s/multinode.md](https://github.com/BretFisher/kubernetes-mastery/tree/mastery/slides/k8s/multinode.md)] --- ## Using network plugins - We need to set up a better network - Before diving into CNI, we will use the `kubenet` plugin - This plugin creates a `cbr0` bridge and connects the containers to that bridge - This plugin allocates IP addresses from a range: - either specified to kubelet (e.g. with `--pod-cidr`) - or stored in the node's `spec.podCIDR` field .footnote[See [here] for more details about this `kubenet` plugin.] [here]: https://kubernetes.io/docs/concepts/extend-kubernetes/compute-storage-net/network-plugins/#kubenet .debug[[k8s/multinode.md](https://github.com/BretFisher/kubernetes-mastery/tree/mastery/slides/k8s/multinode.md)] --- ## What `kubenet` does and *does not* do - It allocates IP addresses to pods *locally* (each node has its own local subnet) - It connects the pods to a *local* bridge (pods on the same node can communicate together; not with other nodes) - It doesn't set up routing or tunneling (we get pods on separated networks; we need to connect them somehow) - It doesn't allocate subnets to nodes (this can be done manually, or by the controller manager) .debug[[k8s/multinode.md](https://github.com/BretFisher/kubernetes-mastery/tree/mastery/slides/k8s/multinode.md)] --- ## Setting up routing or tunneling - *On each node*, we will add routes to the other nodes' pod network - Of course, this is not convenient or scalable! - We will see better techniques to do this; but for now, hang on! .debug[[k8s/multinode.md](https://github.com/BretFisher/kubernetes-mastery/tree/mastery/slides/k8s/multinode.md)] --- ## Allocating subnets to nodes - There are multiple options: - passing the subnet to kubelet with the `--pod-cidr` flag - manually setting `spec.podCIDR` on each node - allocating node CIDRs automatically with the controller manager - The last option would be implemented by adding these flags to controller manager: ``` --allocate-node-cidrs=true --cluster-cidr=<cidr> ``` .debug[[k8s/multinode.md](https://github.com/BretFisher/kubernetes-mastery/tree/mastery/slides/k8s/multinode.md)] --- class: extra-details ## The pod CIDR field is not mandatory - `kubenet` needs the pod CIDR, but other plugins don't need it (e.g. because they allocate addresses in multiple pools, or a single big one) - The pod CIDR field may eventually be deprecated and replaced by an annotation (see [kubernetes/kubernetes#57130](https://github.com/kubernetes/kubernetes/issues/57130)) .debug[[k8s/multinode.md](https://github.com/BretFisher/kubernetes-mastery/tree/mastery/slides/k8s/multinode.md)] --- ## Restarting kubelet wih pod CIDR - We need to stop and restart all our kubelets - We will add the `--network-plugin` and `--pod-cidr` flags - We all have a "cluster number" (let's call that `C`) printed on your VM info card - We will use pod CIDR `10.C.N.0/24` (where `N` is the node number: 1, 2, 3) .exercise[ - Stop all the kubelets (Ctrl-C is fine) - Restart them all, adding `--network-plugin=kubenet --pod-cidr 10.C.N.0/24` ] .debug[[k8s/multinode.md](https://github.com/BretFisher/kubernetes-mastery/tree/mastery/slides/k8s/multinode.md)] --- ## What happens to our pods? - When we stop (or kill) kubelet, the containers keep running - When kubelet starts again, it detects the containers .exercise[ - Check that our pods are still here: ```bash kubectl get pods -o wide ``` ] 🤔 But our pods still use local IP addresses! .debug[[k8s/multinode.md](https://github.com/BretFisher/kubernetes-mastery/tree/mastery/slides/k8s/multinode.md)] --- ## Recreating the pods - The IP address of a pod cannot change - kubelet doesn't automatically kill/restart containers with "invalid" addresses <br/> (in fact, from kubelet's point of view, there is no such thing as an "invalid" address) - We must delete our pods and recreate them .exercise[ - Delete all the pods, and let the ReplicaSet recreate them: ```bash kubectl delete pods --all ``` - Wait for the pods to be up again: ```bash kubectl get pods -o wide -w ``` ] .debug[[k8s/multinode.md](https://github.com/BretFisher/kubernetes-mastery/tree/mastery/slides/k8s/multinode.md)] --- ## Adding kube-proxy - Let's start kube-proxy to provide internal load balancing - Then see if we can create a Service and use it to contact our pods .exercise[ - Start kube-proxy: ```bash sudo kube-proxy --kubeconfig ~/.kube/config ``` - Expose our Deployment: ```bash kubectl expose deployment web --port=80 ``` ] .debug[[k8s/multinode.md](https://github.com/BretFisher/kubernetes-mastery/tree/mastery/slides/k8s/multinode.md)] --- ## Test internal load balancing .exercise[ - Retrieve the ClusterIP address: ```bash kubectl get svc web ``` - Send a few requests to the ClusterIP address (with `curl`) ] -- Sometimes it works, sometimes it doesn't. Why? .debug[[k8s/multinode.md](https://github.com/BretFisher/kubernetes-mastery/tree/mastery/slides/k8s/multinode.md)] --- ## Routing traffic - Our pods have new, distinct IP addresses - But they are on host-local, isolated networks - If we try to ping a pod on a different node, it won't work - kube-proxy merely rewrites the destination IP address - But we need that IP address to be reachable in the first place - How do we fix this? (hint: check the title of this slide!) .debug[[k8s/multinode.md](https://github.com/BretFisher/kubernetes-mastery/tree/mastery/slides/k8s/multinode.md)] --- ## Important warning - The technique that we are about to use doesn't work everywhere - It only works if: - all the nodes are directly connected to each other (at layer 2) - the underlying network allows the IP addresses of our pods - If we are on physical machines connected by a switch: OK - If we are on virtual machines in a public cloud: NOT OK - on AWS, we need to disable "source and destination checks" on our instances - on OpenStack, we need to disable "port security" on our network ports .debug[[k8s/multinode.md](https://github.com/BretFisher/kubernetes-mastery/tree/mastery/slides/k8s/multinode.md)] --- ## Routing basics - We need to tell *each* node: "The subnet 10.C.N.0/24 is located on node N" (for all values of N) - This is how we add a route on Linux: ```bash ip route add 10.C.N.0/24 via W.X.Y.Z ``` (where `W.X.Y.Z` is the internal IP address of node N) - We can see the internal IP addresses of our nodes with: ```bash kubectl get nodes -o wide ``` .debug[[k8s/multinode.md](https://github.com/BretFisher/kubernetes-mastery/tree/mastery/slides/k8s/multinode.md)] --- ## Firewalling - By default, Docker prevents containers from using arbitrary IP addresses (by setting up iptables rules) - We need to allow our containers to use our pod CIDR - For simplicity, we will insert a blanket iptables rule allowing all traffic: `iptables -I FORWARD -j ACCEPT` - This has to be done on every node .debug[[k8s/multinode.md](https://github.com/BretFisher/kubernetes-mastery/tree/mastery/slides/k8s/multinode.md)] --- ## Setting up routing .exercise[ - Create all the routes on all the nodes - Insert the iptables rule allowing traffic - Check that you can ping all the pods from one of the nodes - Check that you can `curl` the ClusterIP of the Service successfully ] .debug[[k8s/multinode.md](https://github.com/BretFisher/kubernetes-mastery/tree/mastery/slides/k8s/multinode.md)] --- ## What's next? - We did a lot of manual operations: - allocating subnets to nodes - adding command-line flags to kubelet - updating the routing tables on our nodes - We want to automate all these steps - We want something that works on all networks .debug[[k8s/multinode.md](https://github.com/BretFisher/kubernetes-mastery/tree/mastery/slides/k8s/multinode.md)] --- class: pic .interstitial[] --- name: toc-the-container-network-interface class: title The Container Network Interface .nav[ [Previous section](#toc-adding-nodes-to-the-cluster) | [Back to table of contents](#toc-chapter-13) | [Next section](#toc-api-server-availability) ] .debug[(automatically generated title slide)] --- # The Container Network Interface - Allows us to decouple network configuration from Kubernetes - Implemented by *plugins* - Plugins are executables that will be invoked by kubelet - Plugins are responsible for: - allocating IP addresses for containers - configuring the network for containers - Plugins can be combined and chained when it makes sense .debug[[k8s/cni.md](https://github.com/BretFisher/kubernetes-mastery/tree/mastery/slides/k8s/cni.md)] --- ## Combining plugins - Interface could be created by e.g. `vlan` or `bridge` plugin - IP address could be allocated by e.g. `dhcp` or `host-local` plugin - Interface parameters (MTU, sysctls) could be tweaked by the `tuning` plugin The reference plugins are available [here]. Look in each plugin's directory for its documentation. [here]: https://github.com/containernetworking/plugins/tree/master/plugins .debug[[k8s/cni.md](https://github.com/BretFisher/kubernetes-mastery/tree/mastery/slides/k8s/cni.md)] --- ## How does kubelet know which plugins to use? - The plugin (or list of plugins) is set in the CNI configuration - The CNI configuration is a *single file* in `/etc/cni/net.d` - If there are multiple files in that directory, the first one is used (in lexicographic order) - That path can be changed with the `--cni-conf-dir` flag of kubelet .debug[[k8s/cni.md](https://github.com/BretFisher/kubernetes-mastery/tree/mastery/slides/k8s/cni.md)] --- ## CNI configuration in practice - When we set up the "pod network" (like Calico, Weave...) it ships a CNI configuration (and sometimes, custom CNI plugins) - Very often, that configuration (and plugins) is installed automatically (by a DaemonSet featuring an initContainer with hostPath volumes) - Examples: - Calico [CNI config](https://github.com/projectcalico/calico/blob/1372b56e3bfebe2b9c9cbf8105d6a14764f44159/v2.6/getting-started/kubernetes/installation/hosted/calico.yaml#L25) and [volume](https://github.com/projectcalico/calico/blob/1372b56e3bfebe2b9c9cbf8105d6a14764f44159/v2.6/getting-started/kubernetes/installation/hosted/calico.yaml#L219) - kube-router [CNI config](https://github.com/cloudnativelabs/kube-router/blob/c2f893f64fd60cf6d2b6d3fee7191266c0fc0fe5/daemonset/generic-kuberouter.yaml#L10) and [volume](https://github.com/cloudnativelabs/kube-router/blob/c2f893f64fd60cf6d2b6d3fee7191266c0fc0fe5/daemonset/generic-kuberouter.yaml#L73) .debug[[k8s/cni.md](https://github.com/BretFisher/kubernetes-mastery/tree/mastery/slides/k8s/cni.md)] --- class: extra-details ## Conf vs conflist - There are two slightly different configuration formats - Basic configuration format: - holds configuration for a single plugin - typically has a `.conf` name suffix - has a `type` string field in the top-most structure - [examples](https://github.com/containernetworking/cni/blob/master/SPEC.md#example-configurations) - Configuration list format: - can hold configuration for multiple (chained) plugins - typically has a `.conflist` name suffix - has a `plugins` list field in the top-most structure - [examples](https://github.com/containernetworking/cni/blob/master/SPEC.md#network-configuration-lists) .debug[[k8s/cni.md](https://github.com/BretFisher/kubernetes-mastery/tree/mastery/slides/k8s/cni.md)] --- class: extra-details ## How plugins are invoked - Parameters are given through environment variables, including: - CNI_COMMAND: desired operation (ADD, DEL, CHECK, or VERSION) - CNI_CONTAINERID: container ID - CNI_NETNS: path to network namespace file - CNI_IFNAME: what the network interface should be named - The network configuration must be provided to the plugin on stdin (this avoids race conditions that could happen by passing a file path) .debug[[k8s/cni.md](https://github.com/BretFisher/kubernetes-mastery/tree/mastery/slides/k8s/cni.md)] --- ## In practice: kube-router - We are going to set up a new cluster - For this new cluster, we will use kube-router - kube-router will provide the "pod network" (connectivity with pods) - kube-router will also provide internal service connectivity (replacing kube-proxy) .debug[[k8s/cni.md](https://github.com/BretFisher/kubernetes-mastery/tree/mastery/slides/k8s/cni.md)] --- ## How kube-router works - Very simple architecture - Does not introduce new CNI plugins (uses the `bridge` plugin, with `host-local` for IPAM) - Pod traffic is routed between nodes (no tunnel, no new protocol) - Internal service connectivity is implemented with IPVS - Can provide pod network and/or internal service connectivity - kube-router daemon runs on every node .debug[[k8s/cni.md](https://github.com/BretFisher/kubernetes-mastery/tree/mastery/slides/k8s/cni.md)] --- ## What kube-router does - Connect to the API server - Obtain the local node's `podCIDR` - Inject it into the CNI configuration file (we'll use `/etc/cni/net.d/10-kuberouter.conflist`) - Obtain the addresses of all nodes - Establish a *full mesh* BGP peering with the other nodes - Exchange routes over BGP .debug[[k8s/cni.md](https://github.com/BretFisher/kubernetes-mastery/tree/mastery/slides/k8s/cni.md)] --- class: extra-details ## What's BGP? - BGP (Border Gateway Protocol) is the protocol used between internet routers - It [scales](https://www.cidr-report.org/as2.0/) pretty [well](https://www.cidr-report.org/cgi-bin/plota?file=%2fvar%2fdata%2fbgp%2fas2.0%2fbgp-active%2etxt&descr=Active%20BGP%20entries%20%28FIB%29&ylabel=Active%20BGP%20entries%20%28FIB%29&with=step) (it is used to announce the 700k CIDR prefixes of the internet) - It is spoken by many hardware routers from many vendors - It also has many software implementations (Quagga, Bird, FRR...) - Experienced network folks generally know it (and appreciate it) - It also used by Calico (another popular network system for Kubernetes) - Using BGP allows us to interconnect our "pod network" with other systems .debug[[k8s/cni.md](https://github.com/BretFisher/kubernetes-mastery/tree/mastery/slides/k8s/cni.md)] --- ## The plan - We'll work in a new cluster (named `kuberouter`) - We will run a simple control plane (like before) - ... But this time, the controller manager will allocate `podCIDR` subnets (so that we don't have to manually assign subnets to individual nodes) - We will create a DaemonSet for kube-router - We will join nodes to the cluster - The DaemonSet will automatically start a kube-router pod on each node .debug[[k8s/cni.md](https://github.com/BretFisher/kubernetes-mastery/tree/mastery/slides/k8s/cni.md)] --- ## Logging into the new cluster .exercise[ - Log into node `kuberouter1` - Clone the workshop repository: ```bash git clone https://github.com/jpetazzo/container.training ``` - Move to this directory: ```bash cd container.training/compose/kube-router-k8s-control-plane ``` ] .debug[[k8s/cni.md](https://github.com/BretFisher/kubernetes-mastery/tree/mastery/slides/k8s/cni.md)] --- class: extra-details ## Checking the CNI configuration - By default, kubelet gets the CNI configuration from `/etc/cni/net.d` .exercise[ - Check the content of `/etc/cni/net.d` ] (On most machines, at this point, `/etc/cni/net.d` doesn't even exist).) .debug[[k8s/cni.md](https://github.com/BretFisher/kubernetes-mastery/tree/mastery/slides/k8s/cni.md)] --- ## Our control plane - We will use a Compose file to start the control plane - It is similar to the one we used with the `kubenet` cluster - The API server is started with `--allow-privileged` (because we will start kube-router in privileged pods) - The controller manager is started with extra flags too: `--allocate-node-cidrs` and `--cluster-cidr` - We need to edit the Compose file to set the Cluster CIDR .debug[[k8s/cni.md](https://github.com/BretFisher/kubernetes-mastery/tree/mastery/slides/k8s/cni.md)] --- ## Starting the control plane - Our cluster CIDR will be `10.C.0.0/16` (where `C` is our cluster number) .exercise[ - Edit the Compose file to set the Cluster CIDR: ```bash vim docker-compose.yaml ``` - Start the control plane: ```bash docker-compose up ``` ] .debug[[k8s/cni.md](https://github.com/BretFisher/kubernetes-mastery/tree/mastery/slides/k8s/cni.md)] --- ## The kube-router DaemonSet - In the same directory, there is a `kuberouter.yaml` file - It contains the definition for a DaemonSet and a ConfigMap - Before we load it, we also need to edit it - We need to indicate the address of the API server (because kube-router needs to connect to it to retrieve node information) .debug[[k8s/cni.md](https://github.com/BretFisher/kubernetes-mastery/tree/mastery/slides/k8s/cni.md)] --- ## Creating the DaemonSet - The address of the API server will be `http://A.B.C.D:8080` (where `A.B.C.D` is the public address of `kuberouter1`, running the control plane) .exercise[ - Edit the YAML file to set the API server address: ```bash vim kuberouter.yaml ``` - Create the DaemonSet: ```bash kubectl create -f kuberouter.yaml ``` ] Note: the DaemonSet won't create any pods (yet) since there are no nodes (yet). .debug[[k8s/cni.md](https://github.com/BretFisher/kubernetes-mastery/tree/mastery/slides/k8s/cni.md)] --- ## Generating the kubeconfig for kubelet - This is similar to what we did for the `kubenet` cluster .exercise[ - Generate the kubeconfig file (replacing `X.X.X.X` with the address of `kuberouter1`): ```bash kubectl config set-cluster cni --server http://`X.X.X.X`:8080 kubectl config set-context cni --cluster cni kubectl config use-context cni cp ~/.kube/config ~/kubeconfig ``` ] .debug[[k8s/cni.md](https://github.com/BretFisher/kubernetes-mastery/tree/mastery/slides/k8s/cni.md)] --- ## Distributing kubeconfig - We need to copy that kubeconfig file to the other nodes .exercise[ - Copy `kubeconfig` to the other nodes: ```bash for N in 2 3; do scp ~/kubeconfig kuberouter$N: done ``` ] .debug[[k8s/cni.md](https://github.com/BretFisher/kubernetes-mastery/tree/mastery/slides/k8s/cni.md)] --- ## Starting kubelet - We don't need the `--pod-cidr` option anymore (the controller manager will allocate these automatically) - We need to pass `--network-plugin=cni` .exercise[ - Join the first node: ```bash sudo kubelet --kubeconfig ~/kubeconfig --network-plugin=cni ``` - Open more terminals and join the other nodes: ```bash ssh kuberouter2 sudo kubelet --kubeconfig ~/kubeconfig --network-plugin=cni ssh kuberouter3 sudo kubelet --kubeconfig ~/kubeconfig --network-plugin=cni ``` ] .debug[[k8s/cni.md](https://github.com/BretFisher/kubernetes-mastery/tree/mastery/slides/k8s/cni.md)] --- class: extra-details ## Checking the CNI configuration - At this point, kuberouter should have installed its CNI configuration (in `/etc/cni/net.d`) .exercise[ - Check the content of `/etc/cni/net.d` ] - There should be a file created by kuberouter - The file should contain the node's podCIDR .debug[[k8s/cni.md](https://github.com/BretFisher/kubernetes-mastery/tree/mastery/slides/k8s/cni.md)] --- ## Setting up a test - Let's create a Deployment and expose it with a Service .exercise[ - Create a Deployment running a web server: ```bash kubectl create deployment web --image=jpetazzo/httpenv ``` - Scale it so that it spans multiple nodes: ```bash kubectl scale deployment web --replicas=5 ``` - Expose it with a Service: ```bash kubectl expose deployment web --port=8888 ``` ] .debug[[k8s/cni.md](https://github.com/BretFisher/kubernetes-mastery/tree/mastery/slides/k8s/cni.md)] --- ## Checking that everything works .exercise[ - Get the ClusterIP address for the service: ```bash kubectl get svc web ``` - Send a few requests there: ```bash curl `X.X.X.X`:8888 ``` ] Note that if you send multiple requests, they are load-balanced in a round robin manner. This shows that we are using IPVS (vs. iptables, which picked random endpoints). .debug[[k8s/cni.md](https://github.com/BretFisher/kubernetes-mastery/tree/mastery/slides/k8s/cni.md)] --- class: extra-details ## Troubleshooting - What if we need to check that everything is working properly? .exercise[ - Check the IP addresses of our pods: ```bash kubectl get pods -o wide ``` - Check our routing table: ```bash route -n ip route ``` ] We should see the local pod CIDR connected to `kube-bridge`, and the other nodes' pod CIDRs having individual routes, with each node being the gateway. .debug[[k8s/cni.md](https://github.com/BretFisher/kubernetes-mastery/tree/mastery/slides/k8s/cni.md)] --- class: extra-details ## More troubleshooting - We can also look at the output of the kube-router pods (with `kubectl logs`) - kube-router also comes with a special shell that gives lots of useful info (we can access it with `kubectl exec`) - But with the current setup of the cluster, these options may not work! - Why? .debug[[k8s/cni.md](https://github.com/BretFisher/kubernetes-mastery/tree/mastery/slides/k8s/cni.md)] --- class: extra-details ## Trying `kubectl logs` / `kubectl exec` .exercise[ - Try to show the logs of a kube-router pod: ```bash kubectl -n kube-system logs ds/kube-router ``` - Or try to exec into one of the kube-router pods: ```bash kubectl -n kube-system exec kube-router-xxxxx bash ``` ] These commands will give an error message that includes: ``` dial tcp: lookup kuberouterX on 127.0.0.11:53: no such host ``` What does that mean? .debug[[k8s/cni.md](https://github.com/BretFisher/kubernetes-mastery/tree/mastery/slides/k8s/cni.md)] --- class: extra-details ## Internal name resolution - To execute these commands, the API server needs to connect to kubelet - By default, it creates a connection using the kubelet's name (e.g. `http://kuberouter1:...`) - This requires our nodes names to be in DNS - We can change that by setting a flag on the API server: `--kubelet-preferred-address-types=InternalIP` .debug[[k8s/cni.md](https://github.com/BretFisher/kubernetes-mastery/tree/mastery/slides/k8s/cni.md)] --- class: extra-details ## Another way to check the logs - We can also ask the logs directly to the container engine - First, get the container ID, with `docker ps` or like this: ```bash CID=$(docker ps -q \ --filter label=io.kubernetes.pod.namespace=kube-system \ --filter label=io.kubernetes.container.name=kube-router) ``` - Then view the logs: ```bash docker logs $CID ``` .debug[[k8s/cni.md](https://github.com/BretFisher/kubernetes-mastery/tree/mastery/slides/k8s/cni.md)] --- class: extra-details ## Other ways to distribute routing tables - We don't need kube-router and BGP to distribute routes - The list of nodes (and associated `podCIDR` subnets) is available through the API - This shell snippet generates the commands to add all required routes on a node: ```bash NODES=$(kubectl get nodes -o name | cut -d/ -f2) for DESTNODE in $NODES; do if [ "$DESTNODE" != "$HOSTNAME" ]; then echo $(kubectl get node $DESTNODE -o go-template=" route add -net {{.spec.podCIDR}} gw {{(index .status.addresses 0).address}}") fi done ``` - This could be useful for embedded platforms with very limited resources (or lab environments for learning purposes) .debug[[k8s/cni.md](https://github.com/BretFisher/kubernetes-mastery/tree/mastery/slides/k8s/cni.md)] --- class: pic .interstitial[] --- name: toc-api-server-availability class: title API server availability .nav[ [Previous section](#toc-the-container-network-interface) | [Back to table of contents](#toc-chapter-13) | [Next section](#toc-static-pods) ] .debug[(automatically generated title slide)] --- # API server availability - When we set up a node, we need the address of the API server: - for kubelet - for kube-proxy - sometimes for the pod network system (like kube-router) - How do we ensure the availability of that endpoint? (what if the node running the API server goes down?) .debug[[k8s/apilb.md](https://github.com/BretFisher/kubernetes-mastery/tree/mastery/slides/k8s/apilb.md)] --- ## Option 1: external load balancer - Set up an external load balancer - Point kubelet (and other components) to that load balancer - Put the node(s) running the API server behind that load balancer - Update the load balancer if/when an API server node needs to be replaced - On cloud infrastructures, some mechanisms provide automation for this (e.g. on AWS, an Elastic Load Balancer + Auto Scaling Group) - [Example in Kubernetes The Hard Way](https://github.com/kelseyhightower/kubernetes-the-hard-way/blob/master/docs/08-bootstrapping-kubernetes-controllers.md#the-kubernetes-frontend-load-balancer) .debug[[k8s/apilb.md](https://github.com/BretFisher/kubernetes-mastery/tree/mastery/slides/k8s/apilb.md)] --- ## Option 2: local load balancer - Set up a load balancer (like NGINX, HAProxy...) on *each* node - Configure that load balancer to send traffic to the API server node(s) - Point kubelet (and other components) to `localhost` - Update the load balancer configuration when API server nodes are updated .debug[[k8s/apilb.md](https://github.com/BretFisher/kubernetes-mastery/tree/mastery/slides/k8s/apilb.md)] --- ## Updating the local load balancer config - Distribute the updated configuration (push) - Or regularly check for updates (pull) - The latter requires an external, highly available store (it could be an object store, an HTTP server, or even DNS...) - Updates can be facilitated by a DaemonSet (but remember that it can't be used when installing a new node!) .debug[[k8s/apilb.md](https://github.com/BretFisher/kubernetes-mastery/tree/mastery/slides/k8s/apilb.md)] --- ## Option 3: DNS records - Put all the API server nodes behind a round-robin DNS - Point kubelet (and other components) to that name - Update the records when needed - Note: this option is not officially supported (but since kubelet supports reconnection anyway, it *should* work) .debug[[k8s/apilb.md](https://github.com/BretFisher/kubernetes-mastery/tree/mastery/slides/k8s/apilb.md)] --- ## Option 4: .................... - Many managed clusters expose a high-availability API endpoint (and you don't have to worry about it) - You can also use HA mechanisms that you're familiar with (e.g. virtual IPs) - Tunnels are also fine (e.g. [k3s](https://k3s.io/) uses a tunnel to allow each node to contact the API server) .debug[[k8s/apilb.md](https://github.com/BretFisher/kubernetes-mastery/tree/mastery/slides/k8s/apilb.md)] --- class: pic .interstitial[] --- name: toc-static-pods class: title Static pods .nav[ [Previous section](#toc-api-server-availability) | [Back to table of contents](#toc-chapter-13) | [Next section](#toc-upgrading-clusters) ] .debug[(automatically generated title slide)] --- # Static pods - Hosting the Kubernetes control plane on Kubernetes has advantages: - we can use Kubernetes' replication and scaling features for the control plane - we can leverage rolling updates to upgrade the control plane - However, there is a catch: - deploying on Kubernetes requires the API to be available - the API won't be available until the control plane is deployed - How can we get out of that chicken-and-egg problem? .debug[[k8s/staticpods.md](https://github.com/BretFisher/kubernetes-mastery/tree/mastery/slides/k8s/staticpods.md)] --- ## A possible approach - Since each component of the control plane can be replicated... - We could set up the control plane outside of the cluster - Then, once the cluster is fully operational, create replicas running on the cluster - Finally, remove the replicas that are running outside of the cluster *What could possibly go wrong?* .debug[[k8s/staticpods.md](https://github.com/BretFisher/kubernetes-mastery/tree/mastery/slides/k8s/staticpods.md)] --- ## Sawing off the branch you're sitting on - What if anything goes wrong? (During the setup or at a later point) - Worst case scenario, we might need to: - set up a new control plane (outside of the cluster) - restore a backup from the old control plane - move the new control plane to the cluster (again) - This doesn't sound like a great experience .debug[[k8s/staticpods.md](https://github.com/BretFisher/kubernetes-mastery/tree/mastery/slides/k8s/staticpods.md)] --- ## Static pods to the rescue - Pods are started by kubelet (an agent running on every node) - To know which pods it should run, the kubelet queries the API server - The kubelet can also get a list of *static pods* from: - a directory containing one (or multiple) *manifests*, and/or - a URL (serving a *manifest*) - These "manifests" are basically YAML definitions (As produced by `kubectl get pod my-little-pod -o yaml`) .debug[[k8s/staticpods.md](https://github.com/BretFisher/kubernetes-mastery/tree/mastery/slides/k8s/staticpods.md)] --- ## Static pods are dynamic - Kubelet will periodically reload the manifests - It will start/stop pods accordingly (i.e. it is not necessary to restart the kubelet after updating the manifests) - When connected to the Kubernetes API, the kubelet will create *mirror pods* - Mirror pods are copies of the static pods (so they can be seen with e.g. `kubectl get pods`) .debug[[k8s/staticpods.md](https://github.com/BretFisher/kubernetes-mastery/tree/mastery/slides/k8s/staticpods.md)] --- ## Bootstrapping a cluster with static pods - We can run control plane components with these static pods - They can start without requiring access to the API server - Once they are up and running, the API becomes available - These pods are then visible through the API (We cannot upgrade them from the API, though) *This is how kubeadm has initialized our clusters.* .debug[[k8s/staticpods.md](https://github.com/BretFisher/kubernetes-mastery/tree/mastery/slides/k8s/staticpods.md)] --- ## Static pods vs normal pods - The API only gives us read-only access to static pods - We can `kubectl delete` a static pod... ...But the kubelet will re-mirror it immediately - Static pods can be selected just like other pods (So they can receive service traffic) - A service can select a mixture of static and other pods .debug[[k8s/staticpods.md](https://github.com/BretFisher/kubernetes-mastery/tree/mastery/slides/k8s/staticpods.md)] --- ## From static pods to normal pods - Once the control plane is up and running, it can be used to create normal pods - We can then set up a copy of the control plane in normal pods - Then the static pods can be removed - The scheduler and the controller manager use leader election (Only one is active at a time; removing an instance is seamless) - Each instance of the API server adds itself to the `kubernetes` service - Etcd will typically require more work! .debug[[k8s/staticpods.md](https://github.com/BretFisher/kubernetes-mastery/tree/mastery/slides/k8s/staticpods.md)] --- ## From normal pods back to static pods - Alright, but what if the control plane is down and we need to fix it? - We restart it using static pods! - This can be done automatically with the [Pod Checkpointer] - The Pod Checkpointer automatically generates manifests of running pods - The manifests are used to restart these pods if API contact is lost (More details in the [Pod Checkpointer] documentation page) - This technique is used by [bootkube] [Pod Checkpointer]: https://github.com/kubernetes-incubator/bootkube/blob/master/cmd/checkpoint/README.md [bootkube]: https://github.com/kubernetes-incubator/bootkube .debug[[k8s/staticpods.md](https://github.com/BretFisher/kubernetes-mastery/tree/mastery/slides/k8s/staticpods.md)] --- ## Where should the control plane run? *Is it better to run the control plane in static pods, or normal pods?* - If I'm a *user* of the cluster: I don't care, it makes no difference to me - What if I'm an *admin*, i.e. the person who installs, upgrades, repairs... the cluster? - If I'm using a managed Kubernetes cluster (AKS, EKS, GKE...) it's not my problem (I'm not the one setting up and managing the control plane) - If I already picked a tool (kubeadm, kops...) to set up my cluster, the tool decides for me - What if I haven't picked a tool yet, or if I'm installing from scratch? - static pods = easier to set up, easier to troubleshoot, less risk of outage - normal pods = easier to upgrade, easier to move (if nodes need to be shut down) .debug[[k8s/staticpods.md](https://github.com/BretFisher/kubernetes-mastery/tree/mastery/slides/k8s/staticpods.md)] --- ## Static pods in action - On our clusters, the `staticPodPath` is `/etc/kubernetes/manifests` .exercise[ - Have a look at this directory: ```bash ls -l /etc/kubernetes/manifests ``` ] We should see YAML files corresponding to the pods of the control plane. .debug[[k8s/staticpods.md](https://github.com/BretFisher/kubernetes-mastery/tree/mastery/slides/k8s/staticpods.md)] --- class: static-pods-exercise ## Running a static pod - We are going to add a pod manifest to the directory, and kubelet will run it .exercise[ - Copy a manifest to the directory: ```bash sudo cp ~/container.training/k8s/just-a-pod.yaml /etc/kubernetes/manifests ``` - Check that it's running: ```bash kubectl get pods ``` ] The output should include a pod named `hello-node1`. .debug[[k8s/staticpods.md](https://github.com/BretFisher/kubernetes-mastery/tree/mastery/slides/k8s/staticpods.md)] --- class: static-pods-exercise ## Remarks In the manifest, the pod was named `hello`. ```yaml apiVersion: v1 kind: Pod metadata: name: hello namespace: default spec: containers: - name: hello image: nginx ``` The `-node1` suffix was added automatically by kubelet. If we delete the pod (with `kubectl delete`), it will be recreated immediately. To delete the pod, we need to delete (or move) the manifest file. .debug[[k8s/staticpods.md](https://github.com/BretFisher/kubernetes-mastery/tree/mastery/slides/k8s/staticpods.md)] --- class: pic .interstitial[] --- name: toc-upgrading-clusters class: title Upgrading clusters .nav[ [Previous section](#toc-static-pods) | [Back to table of contents](#toc-chapter-14) | [Next section](#toc-backing-up-clusters) ] .debug[(automatically generated title slide)] --- # Upgrading clusters - It's *recommended* to run consistent versions across a cluster (mostly to have feature parity and latest security updates) - It's not *mandatory* (otherwise, cluster upgrades would be a nightmare!) - Components can be upgraded one at a time without problems <!-- ##VERSION## --> .debug[[k8s/cluster-upgrade.md](https://github.com/BretFisher/kubernetes-mastery/tree/mastery/slides/k8s/cluster-upgrade.md)] --- ## Checking what we're running - It's easy to check the version for the API server .exercise[ - Log into node `test1` - Check the version of kubectl and of the API server: ```bash kubectl version ``` ] - In a HA setup with multiple API servers, they can have different versions - Running the command above multiple times can return different values .debug[[k8s/cluster-upgrade.md](https://github.com/BretFisher/kubernetes-mastery/tree/mastery/slides/k8s/cluster-upgrade.md)] --- ## Node versions - It's also easy to check the version of kubelet .exercise[ - Check node versions (includes kubelet, kernel, container engine): ```bash kubectl get nodes -o wide ``` ] - Different nodes can run different kubelet versions - Different nodes can run different kernel versions - Different nodes can run different container engines .debug[[k8s/cluster-upgrade.md](https://github.com/BretFisher/kubernetes-mastery/tree/mastery/slides/k8s/cluster-upgrade.md)] --- ## Control plane versions - If the control plane is self-hosted (running in pods), we can check it .exercise[ - Show image versions for all pods in `kube-system` namespace: ```bash kubectl --namespace=kube-system get pods -o json \ | jq -r ' .items[] | [.spec.nodeName, .metadata.name] + (.spec.containers[].image | split(":")) | @tsv ' \ | column -t ``` ] .debug[[k8s/cluster-upgrade.md](https://github.com/BretFisher/kubernetes-mastery/tree/mastery/slides/k8s/cluster-upgrade.md)] --- ## What version are we running anyway? - When I say, "I'm running Kubernetes 1.15", is that the version of: - kubectl - API server - kubelet - controller manager - something else? .debug[[k8s/cluster-upgrade.md](https://github.com/BretFisher/kubernetes-mastery/tree/mastery/slides/k8s/cluster-upgrade.md)] --- ## Other versions that are important - etcd - kube-dns or CoreDNS - CNI plugin(s) - Network controller, network policy controller - Container engine - Linux kernel .debug[[k8s/cluster-upgrade.md](https://github.com/BretFisher/kubernetes-mastery/tree/mastery/slides/k8s/cluster-upgrade.md)] --- ## General guidelines - To update a component, use whatever was used to install it - If it's a distro package, update that distro package - If it's a container or pod, update that container or pod - If you used configuration management, update with that .debug[[k8s/cluster-upgrade.md](https://github.com/BretFisher/kubernetes-mastery/tree/mastery/slides/k8s/cluster-upgrade.md)] --- ## Know where your binaries come from - Sometimes, we need to upgrade *quickly* (when a vulnerability is announced and patched) - If we are using an installer, we should: - make sure it's using upstream packages - or make sure that whatever packages it uses are current - make sure we can tell it to pin specific component versions .debug[[k8s/cluster-upgrade.md](https://github.com/BretFisher/kubernetes-mastery/tree/mastery/slides/k8s/cluster-upgrade.md)] --- ## Important questions - Should we upgrade the control plane before or after the kubelets? - Within the control plane, should we upgrade the API server first or last? - How often should we upgrade? - How long are versions maintained? - All the answers are in [the documentation about version skew policy](https://kubernetes.io/docs/setup/release/version-skew-policy/)! - Let's review the key elements together ... .debug[[k8s/cluster-upgrade.md](https://github.com/BretFisher/kubernetes-mastery/tree/mastery/slides/k8s/cluster-upgrade.md)] --- ## Kubernetes uses semantic versioning - Kubernetes versions look like MAJOR.MINOR.PATCH; e.g. in 1.17.2: - MAJOR = 1 - MINOR = 17 - PATCH = 2 - It's always possible to mix and match different PATCH releases (e.g. 1.16.1 and 1.16.6 are compatible) - It is recommended to run the latest PATCH release (but it's mandatory only when there is a security advisory) .debug[[k8s/cluster-upgrade.md](https://github.com/BretFisher/kubernetes-mastery/tree/mastery/slides/k8s/cluster-upgrade.md)] --- ## Version skew - API server must be more recent than its clients (kubelet and control plane) - ... Which means it must always be upgraded first - All components support a difference of one¹ MINOR version - This allows live upgrades (since we can mix e.g. 1.15 and 1.16) - It also means that going from 1.14 to 1.16 requires going through 1.15 .footnote[¹Except kubelet, which can be up to two MINOR behind API server, and kubectl, which can be one MINOR ahead or behind API server.] .debug[[k8s/cluster-upgrade.md](https://github.com/BretFisher/kubernetes-mastery/tree/mastery/slides/k8s/cluster-upgrade.md)] --- ## Release cycle - There is a new PATCH relese whenever necessary (every few weeks, or "ASAP" when there is a security vulnerability) - There is a new MINOR release every 3 months (approximately) - At any given time, three MINOR releases are maintained - ... Which means that MINOR releases are maintained approximately 9 months - We should expect to upgrade at least every 3 months (on average) .debug[[k8s/cluster-upgrade.md](https://github.com/BretFisher/kubernetes-mastery/tree/mastery/slides/k8s/cluster-upgrade.md)] --- ## In practice - We are going to update a few cluster components - We will change the kubelet version on one node - We will change the version of the API server - We will work with cluster `test` (nodes `test1`, `test2`, `test3`) .debug[[k8s/cluster-upgrade.md](https://github.com/BretFisher/kubernetes-mastery/tree/mastery/slides/k8s/cluster-upgrade.md)] --- ## Updating the API server - This cluster has been deployed with kubeadm - The control plane runs in *static pods* - These pods are started automatically by kubelet (even when kubelet can't contact the API server) - They are defined in YAML files in `/etc/kubernetes/manifests` (this path is set by a kubelet command-line flag) - kubelet automatically updates the pods when the files are changed .debug[[k8s/cluster-upgrade.md](https://github.com/BretFisher/kubernetes-mastery/tree/mastery/slides/k8s/cluster-upgrade.md)] --- ## Changing the API server version - We will edit the YAML file to use a different image version .exercise[ - Log into node `test1` - Check API server version: ```bash kubectl version ``` - Edit the API server pod manifest: ```bash sudo vim /etc/kubernetes/manifests/kube-apiserver.yaml ``` - Look for the `image:` line, and update it to e.g. `v1.16.0` ] .debug[[k8s/cluster-upgrade.md](https://github.com/BretFisher/kubernetes-mastery/tree/mastery/slides/k8s/cluster-upgrade.md)] --- ## Checking what we've done - The API server will be briefly unavailable while kubelet restarts it .exercise[ - Check the API server version: ```bash kubectl version ``` ] .debug[[k8s/cluster-upgrade.md](https://github.com/BretFisher/kubernetes-mastery/tree/mastery/slides/k8s/cluster-upgrade.md)] --- ## Was that a good idea? -- **No!** -- - Remember the guideline we gave earlier: *To update a component, use whatever was used to install it.* - This control plane was deployed with kubeadm - We should use kubeadm to upgrade it! .debug[[k8s/cluster-upgrade.md](https://github.com/BretFisher/kubernetes-mastery/tree/mastery/slides/k8s/cluster-upgrade.md)] --- ## Updating the whole control plane - Let's make it right, and use kubeadm to upgrade the entire control plane (note: this is possible only because the cluster was installed with kubeadm) .exercise[ - Check what will be upgraded: ```bash sudo kubeadm upgrade plan ``` ] Note 1: kubeadm thinks that our cluster is running 1.16.0. <br/>It is confused by our manual upgrade of the API server! Note 2: kubeadm itself is still version 1.15.9. <br/>It doesn't know how to upgrade do 1.16.X. .debug[[k8s/cluster-upgrade.md](https://github.com/BretFisher/kubernetes-mastery/tree/mastery/slides/k8s/cluster-upgrade.md)] --- ## Upgrading kubeadm - First things first: we need to upgrade kubeadm .exercise[ - Upgrade kubeadm: ``` sudo apt install kubeadm ``` - Check what kubeadm tells us: ``` sudo kubeadm upgrade plan ``` ] Problem: kubeadm doesn't know know how to handle upgrades from version 1.15. This is because we installed version 1.17 (or even later). We need to install kubeadm version 1.16.X. .debug[[k8s/cluster-upgrade.md](https://github.com/BretFisher/kubernetes-mastery/tree/mastery/slides/k8s/cluster-upgrade.md)] --- ## Downgrading kubeadm - We need to go back to version 1.16.X (e.g. 1.16.6) .exercise[ - View available versions for package `kubeadm`: ```bash apt show kubeadm -a | grep ^Version | grep 1.16 ``` - Downgrade kubeadm: ``` sudo apt install kubeadm=1.16.6-00 ``` - Check what kubeadm tells us: ``` sudo kubeadm upgrade plan ``` ] kubeadm should now agree to upgrade to 1.16.6. .debug[[k8s/cluster-upgrade.md](https://github.com/BretFisher/kubernetes-mastery/tree/mastery/slides/k8s/cluster-upgrade.md)] --- ## Upgrading the cluster with kubeadm - Ideally, we should revert our `image:` change (so that kubeadm executes the right migration steps) - Or we can try the upgrade anyway .exercise[ - Perform the upgrade: ```bash sudo kubeadm upgrade apply v1.16.6 ``` ] .debug[[k8s/cluster-upgrade.md](https://github.com/BretFisher/kubernetes-mastery/tree/mastery/slides/k8s/cluster-upgrade.md)] --- ## Updating kubelet - These nodes have been installed using the official Kubernetes packages - We can therefore use `apt` or `apt-get` .exercise[ - Log into node `test3` - View available versions for package `kubelet`: ```bash apt show kubelet -a | grep ^Version ``` - Upgrade kubelet: ```bash sudo apt install kubelet=1.16.6-00 ``` ] .debug[[k8s/cluster-upgrade.md](https://github.com/BretFisher/kubernetes-mastery/tree/mastery/slides/k8s/cluster-upgrade.md)] --- ## Checking what we've done .exercise[ - Log into node `test1` - Check node versions: ```bash kubectl get nodes -o wide ``` - Create a deployment and scale it to make sure that the node still works ] .debug[[k8s/cluster-upgrade.md](https://github.com/BretFisher/kubernetes-mastery/tree/mastery/slides/k8s/cluster-upgrade.md)] --- ## Was that a good idea? -- **Almost!** -- - Yes, kubelet was installed with distribution packages - However, kubeadm took care of configuring kubelet (when doing `kubeadm join ...`) - We were supposed to run a special command *before* upgrading kubelet! - That command should be executed on each node - It will download the kubelet configuration generated by kubeadm .debug[[k8s/cluster-upgrade.md](https://github.com/BretFisher/kubernetes-mastery/tree/mastery/slides/k8s/cluster-upgrade.md)] --- ## Upgrading kubelet the right way - We need to upgrade kubeadm, upgrade kubelet config, then upgrade kubelet (after upgrading the control plane) .exercise[ - Download the configuration on each node, and upgrade kubelet: ```bash for N in 1 2 3; do ssh test$N " sudo apt install kubeadm=1.16.6-00 && sudo kubeadm upgrade node && sudo apt install kubelet=1.16.6-00" done ``` ] .debug[[k8s/cluster-upgrade.md](https://github.com/BretFisher/kubernetes-mastery/tree/mastery/slides/k8s/cluster-upgrade.md)] --- ## Checking what we've done - All our nodes should now be updated to version 1.16.6 .exercise[ - Check nodes versions: ```bash kubectl get nodes -o wide ``` ] .debug[[k8s/cluster-upgrade.md](https://github.com/BretFisher/kubernetes-mastery/tree/mastery/slides/k8s/cluster-upgrade.md)] --- class: extra-details ## Skipping versions - This example worked because we went from 1.15 to 1.16 - If you are upgrading from e.g. 1.14, you will have to go through 1.15 first - This means upgrading kubeadm to 1.15.X, then using it to upgrade the cluster - Then upgrading kubeadm to 1.16.X, etc. - **Make sure to read the release notes before upgrading!** .debug[[k8s/cluster-upgrade.md](https://github.com/BretFisher/kubernetes-mastery/tree/mastery/slides/k8s/cluster-upgrade.md)] --- class: pic .interstitial[] --- name: toc-backing-up-clusters class: title Backing up clusters .nav[ [Previous section](#toc-upgrading-clusters) | [Back to table of contents](#toc-chapter-14) | [Next section](#toc-the-cloud-controller-manager) ] .debug[(automatically generated title slide)] --- # Backing up clusters - Backups can have multiple purposes: - disaster recovery (servers or storage are destroyed or unreachable) - error recovery (human or process has altered or corrupted data) - cloning environments (for testing, validation...) - Let's see the strategies and tools available with Kubernetes! .debug[[k8s/cluster-backup.md](https://github.com/BretFisher/kubernetes-mastery/tree/mastery/slides/k8s/cluster-backup.md)] --- ## Important - Kubernetes helps us with disaster recovery (it gives us replication primitives) - Kubernetes helps us clone / replicate environments (all resources can be described with manifests) - Kubernetes *does not* help us with error recovery - We still need to back up/snapshot our data: - with database backups (mysqldump, pgdump, etc.) - and/or snapshots at the storage layer - and/or traditional full disk backups .debug[[k8s/cluster-backup.md](https://github.com/BretFisher/kubernetes-mastery/tree/mastery/slides/k8s/cluster-backup.md)] --- ## In a perfect world ... - The deployment of our Kubernetes clusters is automated (recreating a cluster takes less than a minute of human time) - All the resources (Deployments, Services...) on our clusters are under version control (never use `kubectl run`; always apply YAML files coming from a repository) - Stateful components are either: - stored on systems with regular snapshots - backed up regularly to an external, durable storage - outside of Kubernetes .debug[[k8s/cluster-backup.md](https://github.com/BretFisher/kubernetes-mastery/tree/mastery/slides/k8s/cluster-backup.md)] --- ## Kubernetes cluster deployment - If our deployment system isn't fully automated, it should at least be documented - Litmus test: how long does it take to deploy a cluster... - for a senior engineer? - for a new hire? - Does it require external intervention? (e.g. provisioning servers, signing TLS certs...) .debug[[k8s/cluster-backup.md](https://github.com/BretFisher/kubernetes-mastery/tree/mastery/slides/k8s/cluster-backup.md)] --- ## Plan B - Full machine backups of the control plane can help - If the control plane is in pods (or containers), pay attention to storage drivers (if the backup mechanism is not container-aware, the backups can take way more resources than they should, or even be unusable!) - If the previous sentence worries you: **automate the deployment of your clusters!** .debug[[k8s/cluster-backup.md](https://github.com/BretFisher/kubernetes-mastery/tree/mastery/slides/k8s/cluster-backup.md)] --- ## Managing our Kubernetes resources - Ideal scenario: - never create a resource directly on a cluster - push to a code repository - a special branch (`production` or even `master`) gets automatically deployed - Some folks call this "GitOps" (it's the logical evolution of configuration management and infrastructure as code) .debug[[k8s/cluster-backup.md](https://github.com/BretFisher/kubernetes-mastery/tree/mastery/slides/k8s/cluster-backup.md)] --- ## GitOps in theory - What do we keep in version control? - For very simple scenarios: source code, Dockerfiles, scripts - For real applications: add resources (as YAML files) - For applications deployed multiple times: Helm, Kustomize... (staging and production count as "multiple times") .debug[[k8s/cluster-backup.md](https://github.com/BretFisher/kubernetes-mastery/tree/mastery/slides/k8s/cluster-backup.md)] --- ## GitOps tooling - Various tools exist (Weave Flux, GitKube...) - These tools are still very young - You still need to write YAML for all your resources - There is no tool to: - list *all* resources in a namespace - get resource YAML in a canonical form - diff YAML descriptions with current state .debug[[k8s/cluster-backup.md](https://github.com/BretFisher/kubernetes-mastery/tree/mastery/slides/k8s/cluster-backup.md)] --- ## GitOps in practice - Start describing your resources with YAML - Leverage a tool like Kustomize or Helm - Make sure that you can easily deploy to a new namespace (or even better: to a new cluster) - When tooling matures, you will be ready .debug[[k8s/cluster-backup.md](https://github.com/BretFisher/kubernetes-mastery/tree/mastery/slides/k8s/cluster-backup.md)] --- ## Plan B - What if we can't describe everything with YAML? - What if we manually create resources and forget to commit them to source control? - What about global resources, that don't live in a namespace? - How can we be sure that we saved *everything*? .debug[[k8s/cluster-backup.md](https://github.com/BretFisher/kubernetes-mastery/tree/mastery/slides/k8s/cluster-backup.md)] --- ## Backing up etcd - All objects are saved in etcd - etcd data should be relatively small (and therefore, quick and easy to back up) - Two options to back up etcd: - snapshot the data directory - use `etcdctl snapshot` .debug[[k8s/cluster-backup.md](https://github.com/BretFisher/kubernetes-mastery/tree/mastery/slides/k8s/cluster-backup.md)] --- ## Making an etcd snapshot - The basic command is simple: ```bash etcdctl snapshot save <filename> ``` - But we also need to specify: - an environment variable to specify that we want etcdctl v3 - the address of the server to back up - the path to the key, certificate, and CA certificate <br/>(if our etcd uses TLS certificates) .debug[[k8s/cluster-backup.md](https://github.com/BretFisher/kubernetes-mastery/tree/mastery/slides/k8s/cluster-backup.md)] --- ## Snapshotting etcd on kubeadm - The following command will work on clusters deployed with kubeadm (and maybe others) - It should be executed on a master node ```bash docker run --rm --net host -v $PWD:/vol \ -v /etc/kubernetes/pki/etcd:/etc/kubernetes/pki/etcd:ro \ -e ETCDCTL_API=3 k8s.gcr.io/etcd:3.3.10 \ etcdctl --endpoints=https://[127.0.0.1]:2379 \ --cacert=/etc/kubernetes/pki/etcd/ca.crt \ --cert=/etc/kubernetes/pki/etcd/healthcheck-client.crt \ --key=/etc/kubernetes/pki/etcd/healthcheck-client.key \ snapshot save /vol/snapshot ``` - It will create a file named `snapshot` in the current directory .debug[[k8s/cluster-backup.md](https://github.com/BretFisher/kubernetes-mastery/tree/mastery/slides/k8s/cluster-backup.md)] --- ## How can we remember all these flags? - Look at the static pod manifest for etcd (in `/etc/kubernetes/manifests`) - The healthcheck probe is calling `etcdctl` with all the right flags 😉👍✌️ - Exercise: write the YAML for a batch job to perform the backup .debug[[k8s/cluster-backup.md](https://github.com/BretFisher/kubernetes-mastery/tree/mastery/slides/k8s/cluster-backup.md)] --- ## Restoring an etcd snapshot - ~~Execute exactly the same command, but replacing `save` with `restore`~~ (Believe it or not, doing that will *not* do anything useful!) - The `restore` command does *not* load a snapshot into a running etcd server - The `restore` command creates a new data directory from the snapshot (it's an offline operation; it doesn't interact with an etcd server) - It will create a new data directory in a temporary container (leaving the running etcd node untouched) .debug[[k8s/cluster-backup.md](https://github.com/BretFisher/kubernetes-mastery/tree/mastery/slides/k8s/cluster-backup.md)] --- ## When using kubeadm 1. Create a new data directory from the snapshot: ```bash sudo rm -rf /var/lib/etcd docker run --rm -v /var/lib:/var/lib -v $PWD:/vol \ -e ETCDCTL_API=3 k8s.gcr.io/etcd:3.3.10 \ etcdctl snapshot restore /vol/snapshot --data-dir=/var/lib/etcd ``` 2. Provision the control plane, using that data directory: ```bash sudo kubeadm init \ --ignore-preflight-errors=DirAvailable--var-lib-etcd ``` 3. Rejoin the other nodes .debug[[k8s/cluster-backup.md](https://github.com/BretFisher/kubernetes-mastery/tree/mastery/slides/k8s/cluster-backup.md)] --- ## The fine print - This only saves etcd state - It **does not** save persistent volumes and local node data - Some critical components (like the pod network) might need to be reset - As a result, our pods might have to be recreated, too - If we have proper liveness checks, this should happen automatically .debug[[k8s/cluster-backup.md](https://github.com/BretFisher/kubernetes-mastery/tree/mastery/slides/k8s/cluster-backup.md)] --- ## More information about etcd backups - [Kubernetes documentation](https://kubernetes.io/docs/tasks/administer-cluster/configure-upgrade-etcd/#built-in-snapshot) about etcd backups - [etcd documentation](https://coreos.com/etcd/docs/latest/op-guide/recovery.html#snapshotting-the-keyspace) about snapshots and restore - [A good blog post by elastisys](https://elastisys.com/2018/12/10/backup-kubernetes-how-and-why/) explaining how to restore a snapshot - [Another good blog post by consol labs](https://labs.consol.de/kubernetes/2018/05/25/kubeadm-backup.html) on the same topic .debug[[k8s/cluster-backup.md](https://github.com/BretFisher/kubernetes-mastery/tree/mastery/slides/k8s/cluster-backup.md)] --- ## Don't forget ... - Also back up the TLS information (at the very least: CA key and cert; API server key and cert) - With clusters provisioned by kubeadm, this is in `/etc/kubernetes/pki` - If you don't: - you will still be able to restore etcd state and bring everything back up - you will need to redistribute user certificates .warning[**TLS information is highly sensitive! <br/>Anyone who has it has full access to your cluster!**] .debug[[k8s/cluster-backup.md](https://github.com/BretFisher/kubernetes-mastery/tree/mastery/slides/k8s/cluster-backup.md)] --- ## Stateful services - It's totally fine to keep your production databases outside of Kubernetes *Especially if you have only one database server!* - Feel free to put development and staging databases on Kubernetes (as long as they don't hold important data) - Using Kubernetes for stateful services makes sense if you have *many* (because then you can leverage Kubernetes automation) .debug[[k8s/cluster-backup.md](https://github.com/BretFisher/kubernetes-mastery/tree/mastery/slides/k8s/cluster-backup.md)] --- ## Snapshotting persistent volumes - Option 1: snapshot volumes out of band (with the API/CLI/GUI of our SAN/cloud/...) - Option 2: storage system integration (e.g. [Portworx](https://docs.portworx.com/portworx-install-with-kubernetes/storage-operations/create-snapshots/) can [create snapshots through annotations](https://docs.portworx.com/portworx-install-with-kubernetes/storage-operations/create-snapshots/snaps-annotations/#taking-periodic-snapshots-on-a-running-pod)) - Option 3: [snapshots through Kubernetes API](https://kubernetes.io/blog/2018/10/09/introducing-volume-snapshot-alpha-for-kubernetes/) (now in alpha for a few storage providers: GCE, OpenSDS, Ceph, Portworx) .debug[[k8s/cluster-backup.md](https://github.com/BretFisher/kubernetes-mastery/tree/mastery/slides/k8s/cluster-backup.md)] --- ## More backup tools - [Stash](https://appscode.com/products/stash/) back up Kubernetes persistent volumes - [ReShifter](https://github.com/mhausenblas/reshifter) cluster state management - ~~Heptio Ark~~ [Velero](https://github.com/heptio/velero) full cluster backup - [kube-backup](https://github.com/pieterlange/kube-backup) simple scripts to save resource YAML to a git repository - [bivac](https://github.com/camptocamp/bivac) Backup Interface for Volumes Attached to Containers .debug[[k8s/cluster-backup.md](https://github.com/BretFisher/kubernetes-mastery/tree/mastery/slides/k8s/cluster-backup.md)] --- class: pic .interstitial[] --- name: toc-the-cloud-controller-manager class: title The Cloud Controller Manager .nav[ [Previous section](#toc-backing-up-clusters) | [Back to table of contents](#toc-chapter-14) | [Next section](#toc-git-based-workflows) ] .debug[(automatically generated title slide)] --- # The Cloud Controller Manager - Kubernetes has many features that are cloud-specific (e.g. providing cloud load balancers when a Service of type LoadBalancer is created) - These features were initially implemented in API server and controller manager - Since Kubernetes 1.6, these features are available through a separate process: the *Cloud Controller Manager* - The CCM is optional, but if we run in a cloud, we probably want it! .debug[[k8s/cloud-controller-manager.md](https://github.com/BretFisher/kubernetes-mastery/tree/mastery/slides/k8s/cloud-controller-manager.md)] --- ## Cloud Controller Manager duties - Creating and updating cloud load balancers - Configuring routing tables in the cloud network (specific to GCE) - Updating node labels to indicate region, zone, instance type... - Obtain node name, internal and external addresses from cloud metadata service - Deleting nodes from Kubernetes when they're deleted in the cloud - Managing *some* volumes (e.g. ELBs, AzureDisks...) (Eventually, volumes will be managed by the Container Storage Interface) .debug[[k8s/cloud-controller-manager.md](https://github.com/BretFisher/kubernetes-mastery/tree/mastery/slides/k8s/cloud-controller-manager.md)] --- ## In-tree vs. out-of-tree - A number of cloud providers are supported "in-tree" (in the main kubernetes/kubernetes repository on GitHub) - More cloud providers are supported "out-of-tree" (with code in different repositories) - There is an [ongoing effort](https://github.com/kubernetes/kubernetes/tree/master/pkg/cloudprovider) to move everything to out-of-tree providers .debug[[k8s/cloud-controller-manager.md](https://github.com/BretFisher/kubernetes-mastery/tree/mastery/slides/k8s/cloud-controller-manager.md)] --- ## In-tree providers The following providers are actively maintained: - Amazon Web Services - Azure - Google Compute Engine - IBM Cloud - OpenStack - VMware vSphere These ones are less actively maintained: - Apache CloudStack - oVirt - VMware Photon .debug[[k8s/cloud-controller-manager.md](https://github.com/BretFisher/kubernetes-mastery/tree/mastery/slides/k8s/cloud-controller-manager.md)] --- ## Out-of-tree providers The list includes the following providers: - DigitalOcean - keepalived (not exactly a cloud; provides VIPs for load balancers) - Linode - Oracle Cloud Infrastructure (And possibly others; there is no central registry for these.) .debug[[k8s/cloud-controller-manager.md](https://github.com/BretFisher/kubernetes-mastery/tree/mastery/slides/k8s/cloud-controller-manager.md)] --- ## Audience questions - What kind of clouds are you using/planning to use? - What kind of details would you like to see in this section? - Would you appreciate details on clouds that you don't / won't use? .debug[[k8s/cloud-controller-manager.md](https://github.com/BretFisher/kubernetes-mastery/tree/mastery/slides/k8s/cloud-controller-manager.md)] --- ## Cloud Controller Manager in practice - Write a configuration file (typically `/etc/kubernetes/cloud.conf`) - Run the CCM process (on self-hosted clusters, this can be a DaemonSet selecting the control plane nodes) - Start kubelet with `--cloud-provider=external` - When using managed clusters, this is done automatically - There is very little documentation on writing the configuration file (except for OpenStack) .debug[[k8s/cloud-controller-manager.md](https://github.com/BretFisher/kubernetes-mastery/tree/mastery/slides/k8s/cloud-controller-manager.md)] --- ## Bootstrapping challenges - When a node joins the cluster, it needs to obtain a signed TLS certificate - That certificate must contain the node's addresses - These addresses are provided by the Cloud Controller Manager (at least the external address) - To get these addresses, the node needs to communicate with the control plane - ...Which means joining the cluster (The problem didn't occur when cloud-specific code was running in kubelet: kubelet could obtain the required information directly from the cloud provider's metadata service.) .debug[[k8s/cloud-controller-manager.md](https://github.com/BretFisher/kubernetes-mastery/tree/mastery/slides/k8s/cloud-controller-manager.md)] --- ## More information about CCM - CCM configuration and operation is highly specific to each cloud provider (which is why this section remains very generic) - The Kubernetes documentation has *some* information: - [architecture and diagrams](https://kubernetes.io/docs/concepts/architecture/cloud-controller/) - [configuration](https://kubernetes.io/docs/concepts/cluster-administration/cloud-providers/) (mainly for OpenStack) - [deployment](https://kubernetes.io/docs/tasks/administer-cluster/running-cloud-controller/) .debug[[k8s/cloud-controller-manager.md](https://github.com/BretFisher/kubernetes-mastery/tree/mastery/slides/k8s/cloud-controller-manager.md)] --- class: pic .interstitial[] --- name: toc-git-based-workflows class: title Git-based workflows .nav[ [Previous section](#toc-the-cloud-controller-manager) | [Back to table of contents](#toc-chapter-14) | [Next section](#toc-last-words) ] .debug[(automatically generated title slide)] --- # Git-based workflows - Deploying with `kubectl` has downsides: - we don't know *who* deployed *what* and *when* - there is no audit trail (except the API server logs) - there is no easy way to undo most operations - there is no review/approval process (like for code reviews) - We have all these things for *code*, though - Can we manage cluster state like we manage our source code? .debug[[k8s/gitworkflows.md](https://github.com/BretFisher/kubernetes-mastery/tree/mastery/slides/k8s/gitworkflows.md)] --- ## Reminder: Kubernetes is *declarative* - All we do is create/change resources - These resources have a perfect YAML representation - All we do is manipulating these YAML representations (`kubectl run` generates a YAML file that gets applied) - We can store these YAML representations in a code repository - We can version that code repository and maintain it with best practices - define which branch(es) can go to qa/staging/production - control who can push to which branches - have formal review processes, pull requests ... .debug[[k8s/gitworkflows.md](https://github.com/BretFisher/kubernetes-mastery/tree/mastery/slides/k8s/gitworkflows.md)] --- ## Enabling git-based workflows - There are a few tools out there to help us do that - We'll see demos of two of them: [Flux] and [Gitkube] - There are *many* other tools, some of them with even more features - There are also *many* integrations with popular CI/CD systems (e.g.: GitLab, Jenkins, ...) [Flux]: https://www.weave.works/oss/flux/ [Gitkube]: https://gitkube.sh/ .debug[[k8s/gitworkflows.md](https://github.com/BretFisher/kubernetes-mastery/tree/mastery/slides/k8s/gitworkflows.md)] --- ## Flux overview - We put our Kubernetes resources as YAML files in a git repository - Flux polls that repository regularly (every 5 minutes by default) - The resources described by the YAML files are created/updated automatically - Changes are made by updating the code in the repository .debug[[k8s/gitworkflows.md](https://github.com/BretFisher/kubernetes-mastery/tree/mastery/slides/k8s/gitworkflows.md)] --- ## Preparing a repository for Flux - We need a repository with Kubernetes YAML files - I have one: https://github.com/jpetazzo/kubercoins - Fork it to your GitHub account - Create a new branch in your fork; e.g. `prod` (e.g. by adding a line in the README through the GitHub web UI) - This is the branch that we are going to use for deployment .debug[[k8s/gitworkflows.md](https://github.com/BretFisher/kubernetes-mastery/tree/mastery/slides/k8s/gitworkflows.md)] --- ## Setting up Flux - Clone the Flux repository: ``` git clone https://github.com/fluxcd/flux ``` - Edit `deploy/flux-deployment.yaml` - Change the `--git-url` and `--git-branch` parameters: ```yaml - --git-url=git@github.com:your-git-username/kubercoins - --git-branch=prod ``` - Apply all the YAML: ``` kubectl apply -f deploy/ ``` .debug[[k8s/gitworkflows.md](https://github.com/BretFisher/kubernetes-mastery/tree/mastery/slides/k8s/gitworkflows.md)] --- ## Allowing Flux to access the repository - When it starts, Flux generates an SSH key - Display that key: ``` kubectl logs deployment/flux | grep identity ``` - Then add that key to the repository, giving it **write** access (some Flux features require write access) - After a minute or so, DockerCoins will be deployed to the current namespace .debug[[k8s/gitworkflows.md](https://github.com/BretFisher/kubernetes-mastery/tree/mastery/slides/k8s/gitworkflows.md)] --- ## Making changes - Make changes (on the `prod` branch), e.g. change `replicas` in `worker` - After a few minutes, the changes will be picked up by Flux and applied .debug[[k8s/gitworkflows.md](https://github.com/BretFisher/kubernetes-mastery/tree/mastery/slides/k8s/gitworkflows.md)] --- ## Other features - Flux can keep a list of all the tags of all the images we're running - The `fluxctl` tool can show us if we're running the latest images - We can also "automate" a resource (i.e. automatically deploy new images) - And much more! .debug[[k8s/gitworkflows.md](https://github.com/BretFisher/kubernetes-mastery/tree/mastery/slides/k8s/gitworkflows.md)] --- ## Gitkube overview - We put our Kubernetes resources as YAML files in a git repository - Gitkube is a git server (or "git remote") - After making changes to the repository, we push to Gitkube - Gitkube applies the resources to the cluster .debug[[k8s/gitworkflows.md](https://github.com/BretFisher/kubernetes-mastery/tree/mastery/slides/k8s/gitworkflows.md)] --- ## Setting up Gitkube - Install the CLI: ``` sudo curl -L -o /usr/local/bin/gitkube \ https://github.com/hasura/gitkube/releases/download/v0.2.1/gitkube_linux_amd64 sudo chmod +x /usr/local/bin/gitkube ``` - Install Gitkube on the cluster: ``` gitkube install --expose ClusterIP ``` .debug[[k8s/gitworkflows.md](https://github.com/BretFisher/kubernetes-mastery/tree/mastery/slides/k8s/gitworkflows.md)] --- ## Creating a Remote - Gitkube provides a new type of API resource: *Remote* (this is using a mechanism called Custom Resource Definitions or CRD) - Create and apply a YAML file containing the following manifest: ```yaml apiVersion: gitkube.sh/v1alpha1 kind: Remote metadata: name: example spec: authorizedKeys: - `ssh-rsa AAA...` manifests: path: "." ``` (replace the `ssh-rsa AAA...` section with the content of `~/.ssh/id_rsa.pub`) .debug[[k8s/gitworkflows.md](https://github.com/BretFisher/kubernetes-mastery/tree/mastery/slides/k8s/gitworkflows.md)] --- ## Pushing to our remote - Get the `gitkubed` IP address: ``` kubectl -n kube-system get svc gitkubed IP=$(kubectl -n kube-system get svc gitkubed -o json | jq -r .spec.clusterIP) ``` - Get ourselves a sample repository with resource YAML files: ``` git clone git://github.com/jpetazzo/kubercoins cd kubercoins ``` - Add the remote and push to it: ``` git remote add k8s ssh://default-example@$IP/~/git/default-example git push k8s master ``` .debug[[k8s/gitworkflows.md](https://github.com/BretFisher/kubernetes-mastery/tree/mastery/slides/k8s/gitworkflows.md)] --- ## Making changes - Edit a local file - Commit - Push! - Make sure that you push to the `k8s` remote .debug[[k8s/gitworkflows.md](https://github.com/BretFisher/kubernetes-mastery/tree/mastery/slides/k8s/gitworkflows.md)] --- ## Other features - Gitkube can also build container images for us (see the [documentation](https://github.com/hasura/gitkube/blob/master/docs/remote.md) for more details) - Gitkube can also deploy Helm charts (instead of raw YAML files) .debug[[k8s/gitworkflows.md](https://github.com/BretFisher/kubernetes-mastery/tree/mastery/slides/k8s/gitworkflows.md)] --- class: pic .interstitial[] --- name: toc-last-words class: title Last words .nav[ [Previous section](#toc-git-based-workflows) | [Back to table of contents](#toc-chapter-15) | [Next section](#toc-links-and-resources) ] .debug[(automatically generated title slide)] --- # Last words - Congratulations! - We learned a lot about Kubernetes, its internals, its advanced concepts -- - That was just the easy part - The hard challenges will revolve around *culture* and *people* -- - ... What does that mean? .debug[[k8s/lastwords.md](https://github.com/BretFisher/kubernetes-mastery/tree/mastery/slides/k8s/lastwords.md)] --- ## Running an app involves many steps - Write the app - Tests, QA ... - Ship *something* (more on that later) - Provision resources (e.g. VMs, clusters) - Deploy the *something* on the resources - Manage, maintain, monitor the resources - Manage, maintain, monitor the app - And much more .debug[[k8s/lastwords.md](https://github.com/BretFisher/kubernetes-mastery/tree/mastery/slides/k8s/lastwords.md)] --- ## Who does what? - The old "devs vs ops" division has changed - In some organizations, "ops" are now called "SRE" or "platform" teams (and they have very different sets of skills) - Do you know which team is responsible for each item on the list on the previous page? - Acknowledge that a lot of tasks are outsourced (e.g. if we add "buy/rack/provision machines" in that list) .debug[[k8s/lastwords.md](https://github.com/BretFisher/kubernetes-mastery/tree/mastery/slides/k8s/lastwords.md)] --- ## What do we ship? - Some organizations embrace "you build it, you run it" - When "build" and "run" are owned by different teams, where's the line? - What does the "build" team ship to the "run" team? - Let's see a few options, and what they imply .debug[[k8s/lastwords.md](https://github.com/BretFisher/kubernetes-mastery/tree/mastery/slides/k8s/lastwords.md)] --- ## Shipping code - Team "build" ships code (hopefully in a repository, identified by a commit hash) - Team "run" containerizes that code ✔️ no extra work for developers ❌ very little advantage of using containers .debug[[k8s/lastwords.md](https://github.com/BretFisher/kubernetes-mastery/tree/mastery/slides/k8s/lastwords.md)] --- ## Shipping container images - Team "build" ships container images (hopefully built automatically from a source repository) - Team "run" uses theses images to create e.g. Kubernetes resources ✔️ universal artefact (support all languages uniformly) ✔️ easy to start a single component (good for monoliths) ❌ complex applications will require a lot of extra work ❌ adding/removing components in the stack also requires extra work ❌ complex applications will run very differently between dev and prod .debug[[k8s/lastwords.md](https://github.com/BretFisher/kubernetes-mastery/tree/mastery/slides/k8s/lastwords.md)] --- ## Shipping Compose files (Or another kind of dev-centric manifest) - Team "build" ships a manifest that works on a single node (as well as images, or ways to build them) - Team "run" adapts that manifest to work on a cluster ✔️ all teams can start the stack in a reliable, deterministic manner ❌ adding/removing components still requires *some* work (but less than before) ❌ there will be *some* differences between dev and prod .debug[[k8s/lastwords.md](https://github.com/BretFisher/kubernetes-mastery/tree/mastery/slides/k8s/lastwords.md)] --- ## Shipping Kubernetes manifests - Team "build" ships ready-to-run manifests (YAML, Helm charts, Kustomize ...) - Team "run" adjusts some parameters and monitors the application ✔️ parity between dev and prod environments ✔️ "run" team can focus on SLAs, SLOs, and overall quality ❌ requires *a lot* of extra work (and new skills) from the "build" team ❌ Kubernetes is not a very convenient development platform (at least, not yet) .debug[[k8s/lastwords.md](https://github.com/BretFisher/kubernetes-mastery/tree/mastery/slides/k8s/lastwords.md)] --- ## What's the right answer? - It depends on our teams - existing skills (do they know how to do it?) - availability (do they have the time to do it?) - potential skills (can they learn to do it?) - It depends on our culture - owning "run" often implies being on call - do we reward on-call duty without encouraging hero syndrome? - do we give people resources (time, money) to learn? .debug[[k8s/lastwords.md](https://github.com/BretFisher/kubernetes-mastery/tree/mastery/slides/k8s/lastwords.md)] --- class: extra-details ## Tools to develop on Kubernetes *If we decide to make Kubernetes the primary development platform, here are a few tools that can help us.* - Docker Desktop - Draft - Minikube - Skaffold - Tilt - ... .debug[[k8s/lastwords.md](https://github.com/BretFisher/kubernetes-mastery/tree/mastery/slides/k8s/lastwords.md)] --- ## Where do we run? - Managed vs. self-hosted - Cloud vs. on-premises - If cloud: public vs. private - Which vendor/distribution to pick? - Which versions/features to enable? .debug[[k8s/lastwords.md](https://github.com/BretFisher/kubernetes-mastery/tree/mastery/slides/k8s/lastwords.md)] --- ## Developer experience - How do we on-board a new developer? - What do they need to install to get a dev stack? - How does a code change make it from dev to prod? - How does someone add a component to a stack? *These questions are good "sanity checks" to validate our strategy!* .debug[[k8s/lastwords.md](https://github.com/BretFisher/kubernetes-mastery/tree/mastery/slides/k8s/lastwords.md)] --- ## Some guidelines - Start small - Outsource what we don't know - Start simple, and stay simple as long as possible (try to stay away from complex features that we don't need) - Automate (regularly check that we can successfully redeploy by following scripts) - Transfer knowledge (make sure everyone is on the same page/level) - Iterate! .debug[[k8s/lastwords.md](https://github.com/BretFisher/kubernetes-mastery/tree/mastery/slides/k8s/lastwords.md)] --- class: pic .interstitial[] --- name: toc-links-and-resources class: title Links and resources .nav[ [Previous section](#toc-last-words) | [Back to table of contents](#toc-chapter-15) | [Next section](#toc-) ] .debug[(automatically generated title slide)] --- # Links and resources All things Kubernetes: - [Kubernetes Community](https://kubernetes.io/community/) - Slack, Google Groups, meetups - [Kubernetes on StackOverflow](https://stackoverflow.com/questions/tagged/kubernetes) - [Play With Kubernetes Hands-On Labs](https://medium.com/@marcosnils/introducing-pwk-play-with-k8s-159fcfeb787b) All things Docker: - [Docker documentation](http://docs.docker.com/) - [Docker Hub](https://hub.docker.com) - [Docker on StackOverflow](https://stackoverflow.com/questions/tagged/docker) - [Play With Docker Hands-On Labs](http://training.play-with-docker.com/) Everything else: - [Local meetups](https://www.meetup.com/) .footnote[These slides (and future updates) are on → http://container.training/] .debug[[k8s/links.md](https://github.com/BretFisher/kubernetes-mastery/tree/mastery/slides/k8s/links.md)] --- class: title, self-paced Thank you! .debug[[shared/thankyou.md](https://github.com/BretFisher/kubernetes-mastery/tree/mastery/slides/shared/thankyou.md)] --- class: title, in-person That's all, folks! <br/> Questions?  .debug[[shared/thankyou.md](https://github.com/BretFisher/kubernetes-mastery/tree/mastery/slides/shared/thankyou.md)]